UX/UI Solutions to Help Increase EV Adoption in Ireland
Video walkthrough of the prototype:
UX Research Case Study
Background
I chose to research the problem of low EV adoption in Ireland as my final research project for my Master’s Thesis at TU Dublin.
More and more countries in Europe and worldwide are leaning towards more sustainable transport solutions. According to the Department of the Taoiseach publication concerning the climate action plan 2021, “emissions from the transport sector accounted for 17.9% of Ireland’s greenhouse gas emissions in 2020” (gov.ie, 2020). Therefore actions concerning greenhouse gas emissions from transportation are essential.
It’s no longer a discussion about whether electric vehicles are better for the environment in terms of CO2 emissions. For example, a study conducted in the UK about the environmental effects of increasing the use of electric cars showed that by switching to all-EV, the country would reduce its yearly CO2 emissions by a whopping 12% (Al-Habaibeh et al., 2019). As a result, the UK government has pledged to reach 100% of all vehicles sold in the country to be EV (this pledge is known as the 2030 ban in the UK – to ban petrol and diesel car sales.
Ireland has also committed to a similarly challenging goal of almost one million electric vehicles in the country by 2030.
The Challenge: Shortfall In EV Adoption
The Climate Action Plan 2021 and the 2021 updated National Development Plan outline a clear target of having nearly one million electric vehicles (‘EVs’) on Ireland’s roads by 2030. Currently, there are approximately 41,000 EVs on Irish roads and 1,350 public charge points.
(Collins, 2021)
Therefore, it seems there is a shortfall in EV adoption. At the time of confirming the Climate Action Plan, 2021, nine years had remained til the deadline of 2030. On average, it would take 119,875 EVs annually to reach the goal of one million electric vehicles by 2030.
DISCOVER (RESEARCH)
IN THIS SECTION:
1. Exploratory (Desk) Research
2. Research Hypothesis
3. User Research Questions
4. Research Methods
–Social media research
-User Interviews
-Perception Survey
5. Stakeholder Analysis
COMING NEXT:
DEFINE (SYNTHESIS)
DEVELOP(IDEATION)
DELIVER(IMPLEMENTATION)
TO THE BEGINNING
TO THE END
Exploratory (Desk) Research
I started the exploratory research by writing an academic literature review that looked at 14 sources from Ireland and abroad, analysing the problem of low EV adoption. When reviewing the literature, I noticed three distinct angles authors tend to take when researching EV adoption. The first set of research papers scrutinises the environmental and behavioural factors preventing EV adoption. The second set of articles examines the profiles of early adopters – who are the people, their environment and their motivations for EV adoption. Finally, the third set of research papers focuses on analysing the existing or proposed solutions and their effectiveness.
The analysis helped me gain a good insight into factors affecting the low EV adoption rates, the existing and proposed solutions, and a profile of early EV adopters that served as proto-personas.
Synthesising the research
To synthesise the exploratory research, after completing the literature review, I ran through it and recorded the main points on sticky notes on the Miro board and categorised them into an affinity diagram.
I came up with four broad thematic categories:
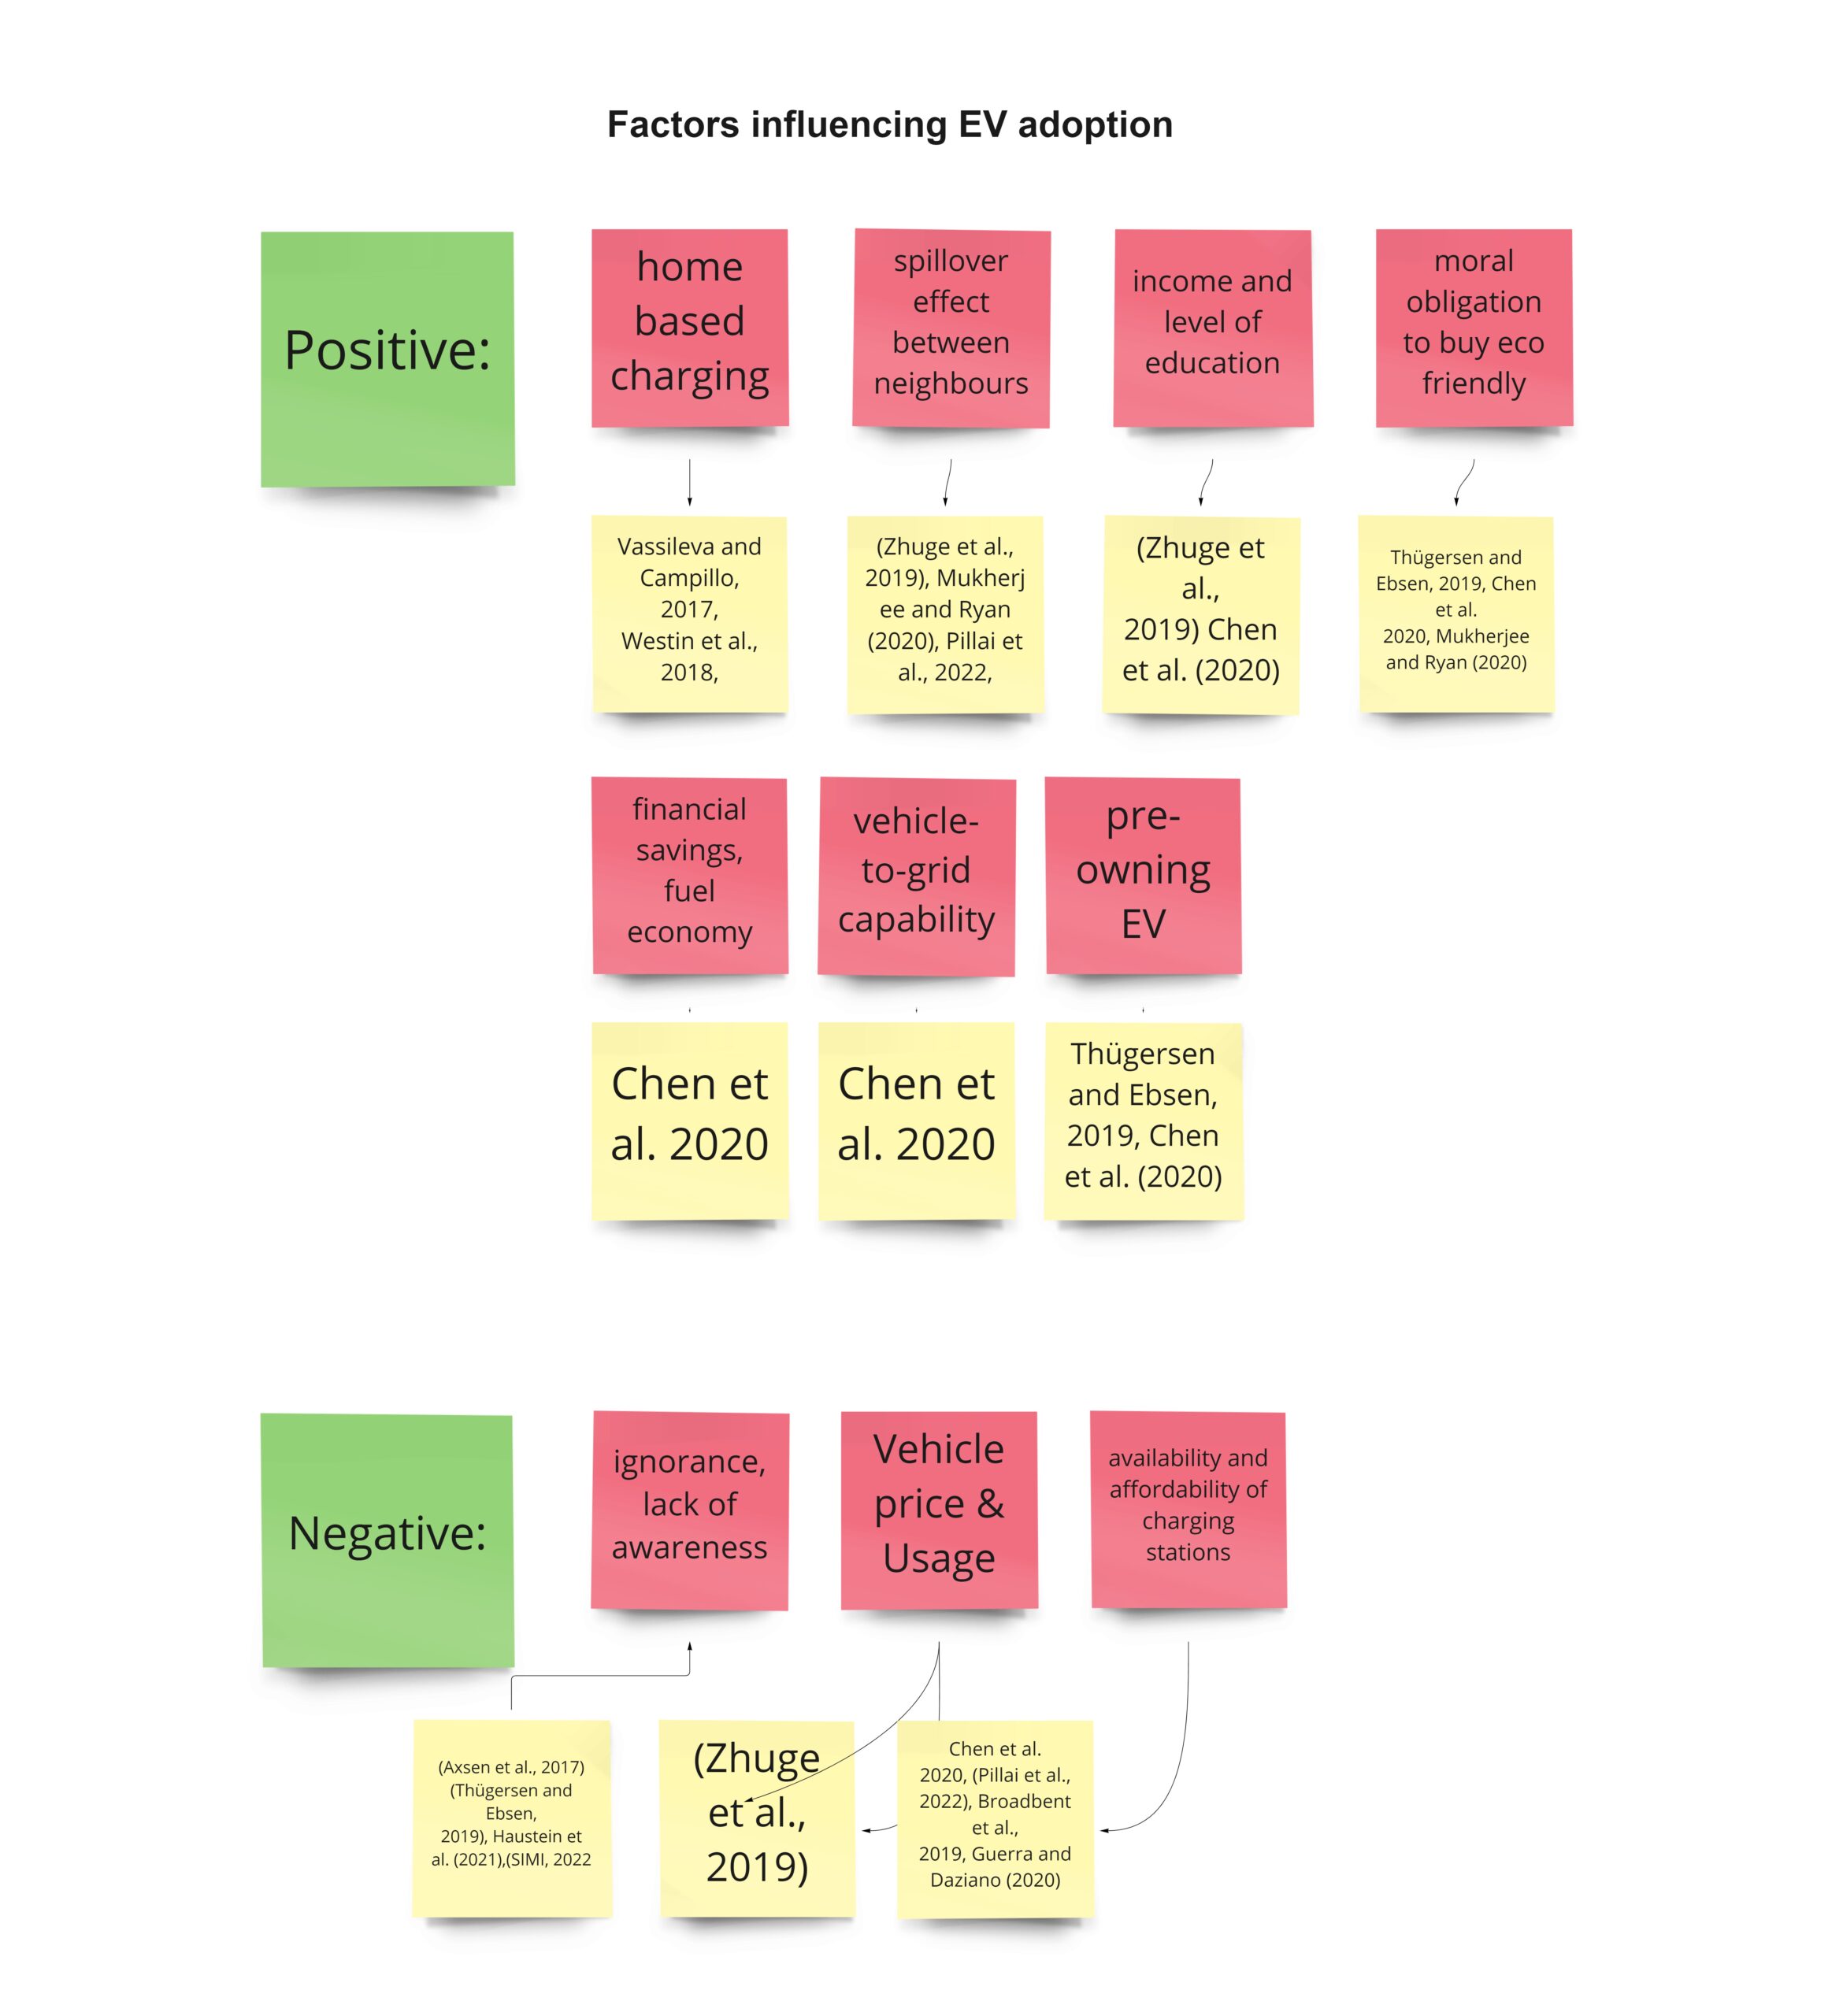
- Positive and negative factors influencing EV adoption rates;
- Early adopters: their profiles, motivations and goals;
- The pain points the potential EV adopters may have;
- Existing and proposed solutions to the low EV adoption in Ireland and abroad.
1. Key factors (positive and negative) affecting EV adoption
Home-based charging, Income level and education, Moral principles, Financial savings and fuel economy, lack of awareness, Vehicle price and usage, Availability and affordability of charging stations.
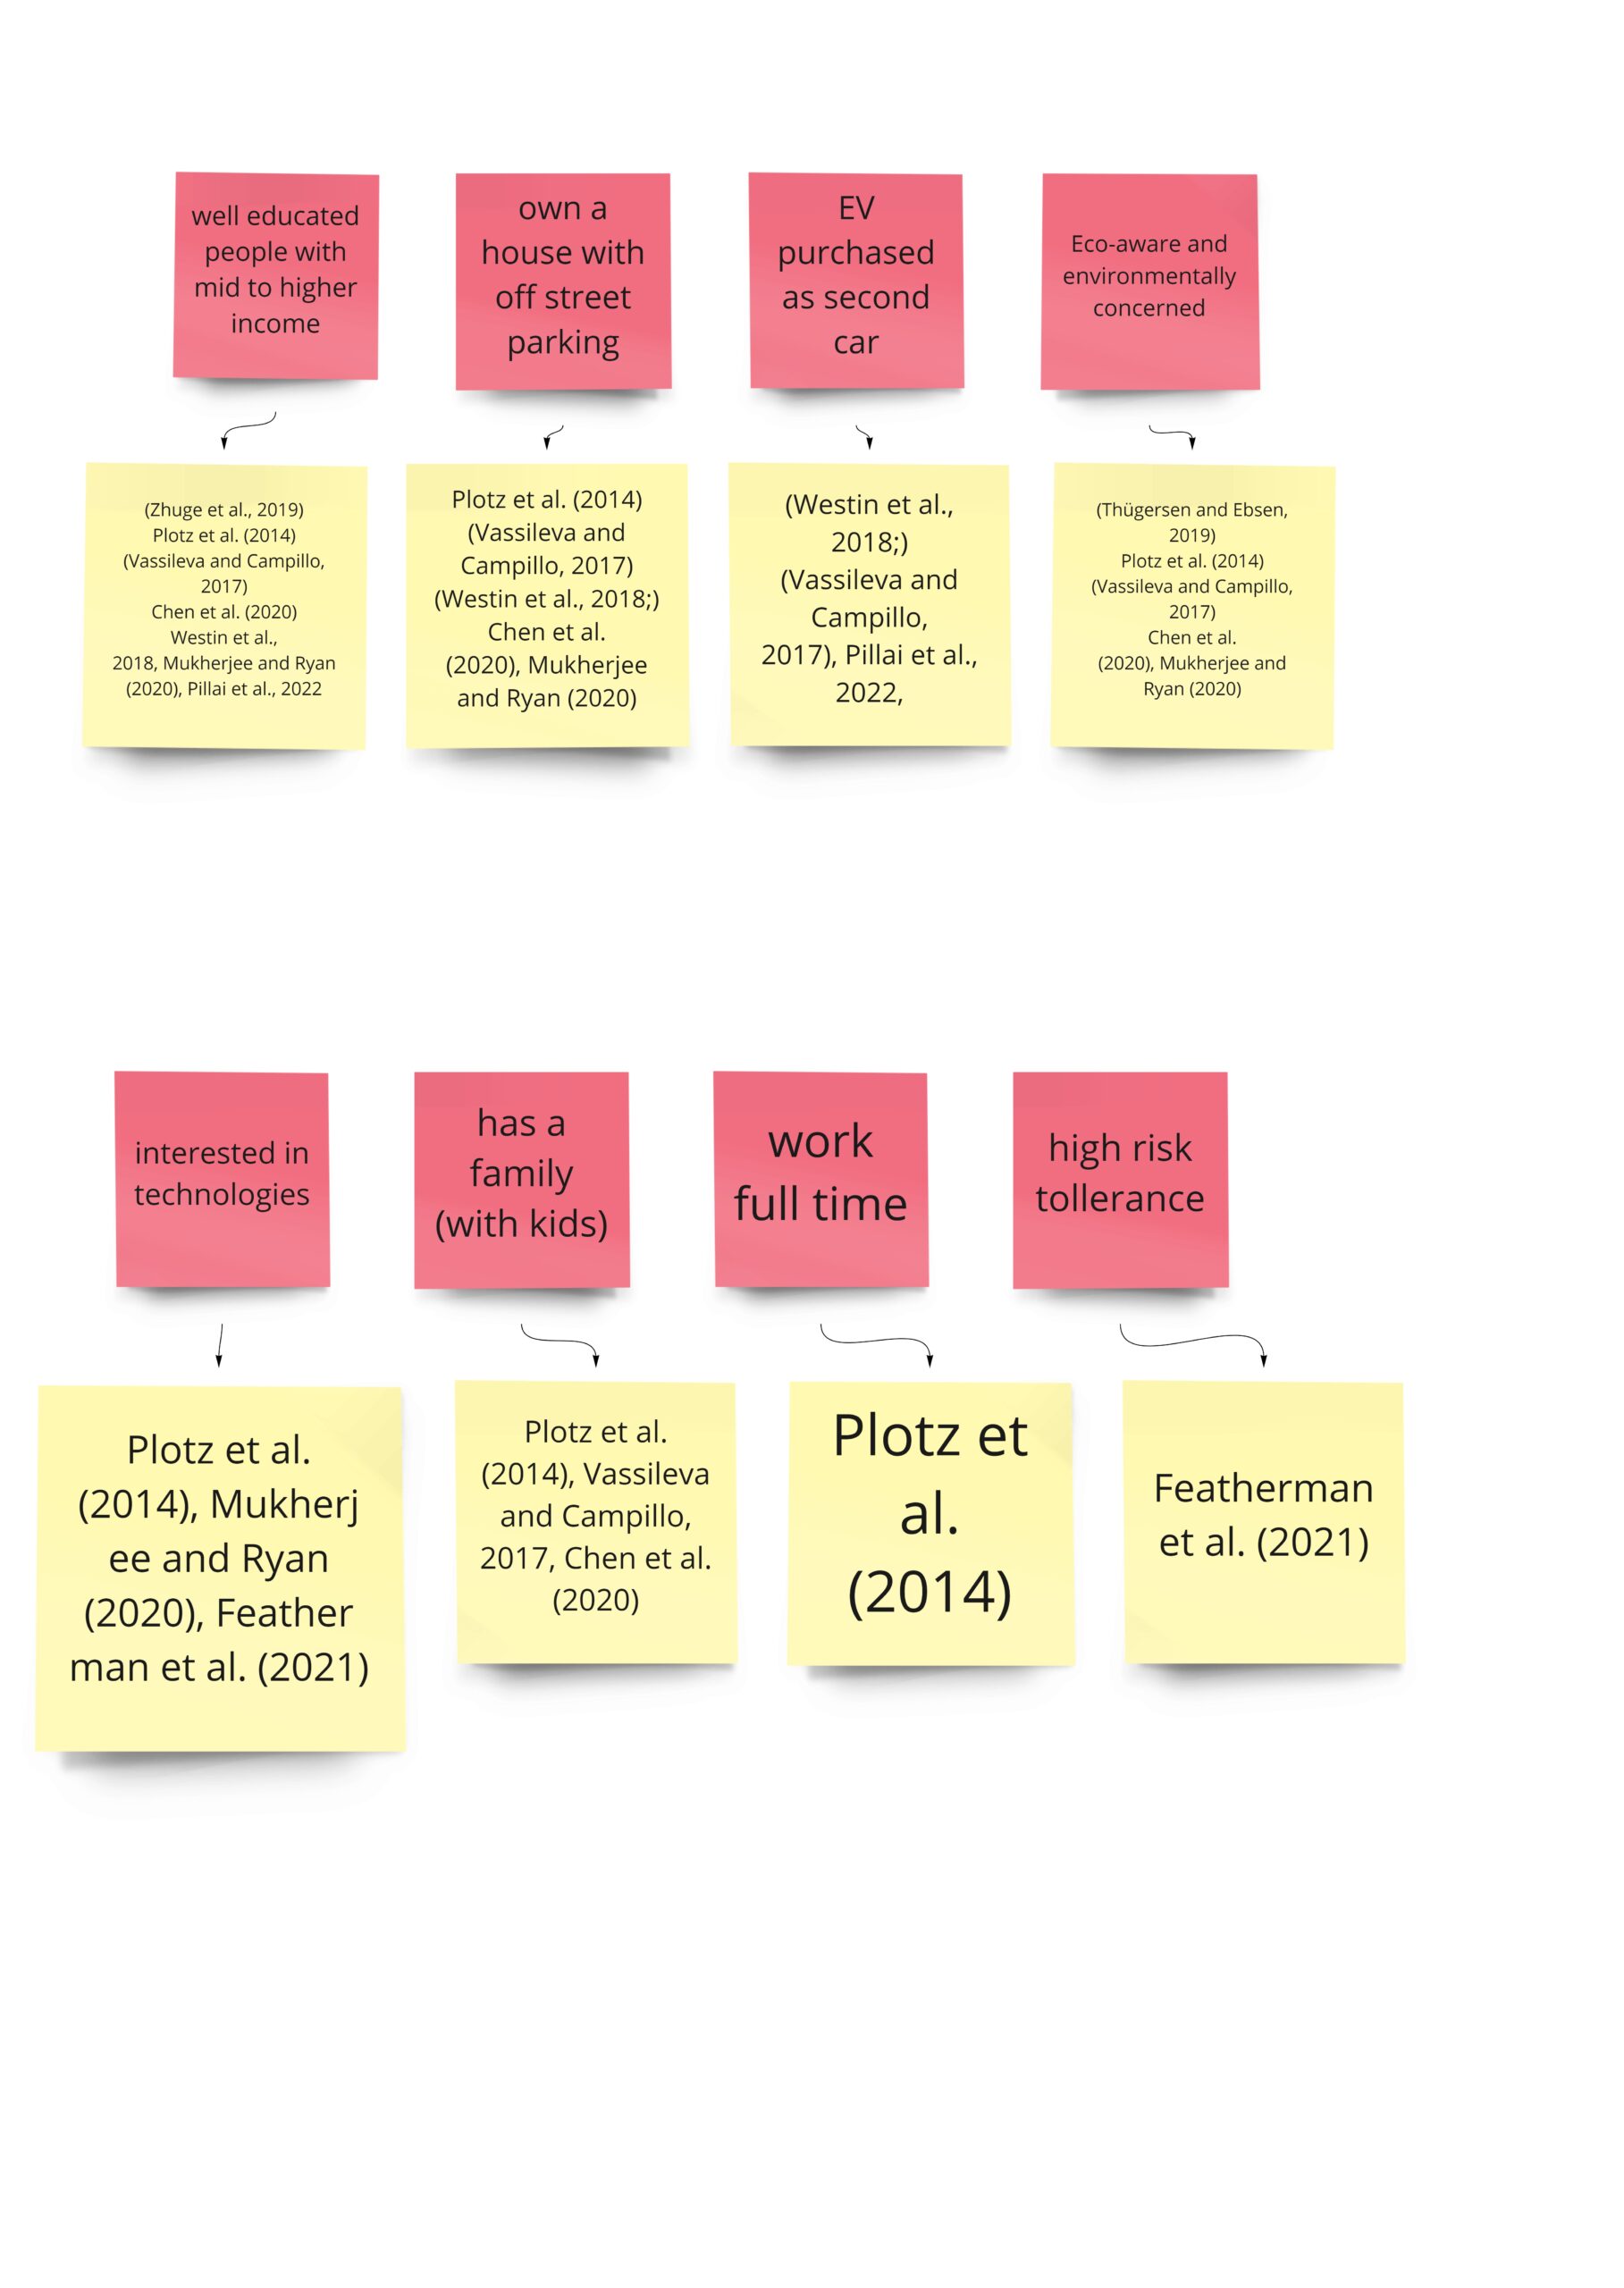
2. Early adopters’ profile analysis
Well-educated with mid to higher income, owns a house with off-street parking, EV purchased as a second car, Eco-aware, interested in technologies, has families with kids, high-risk tolerance and working full time.
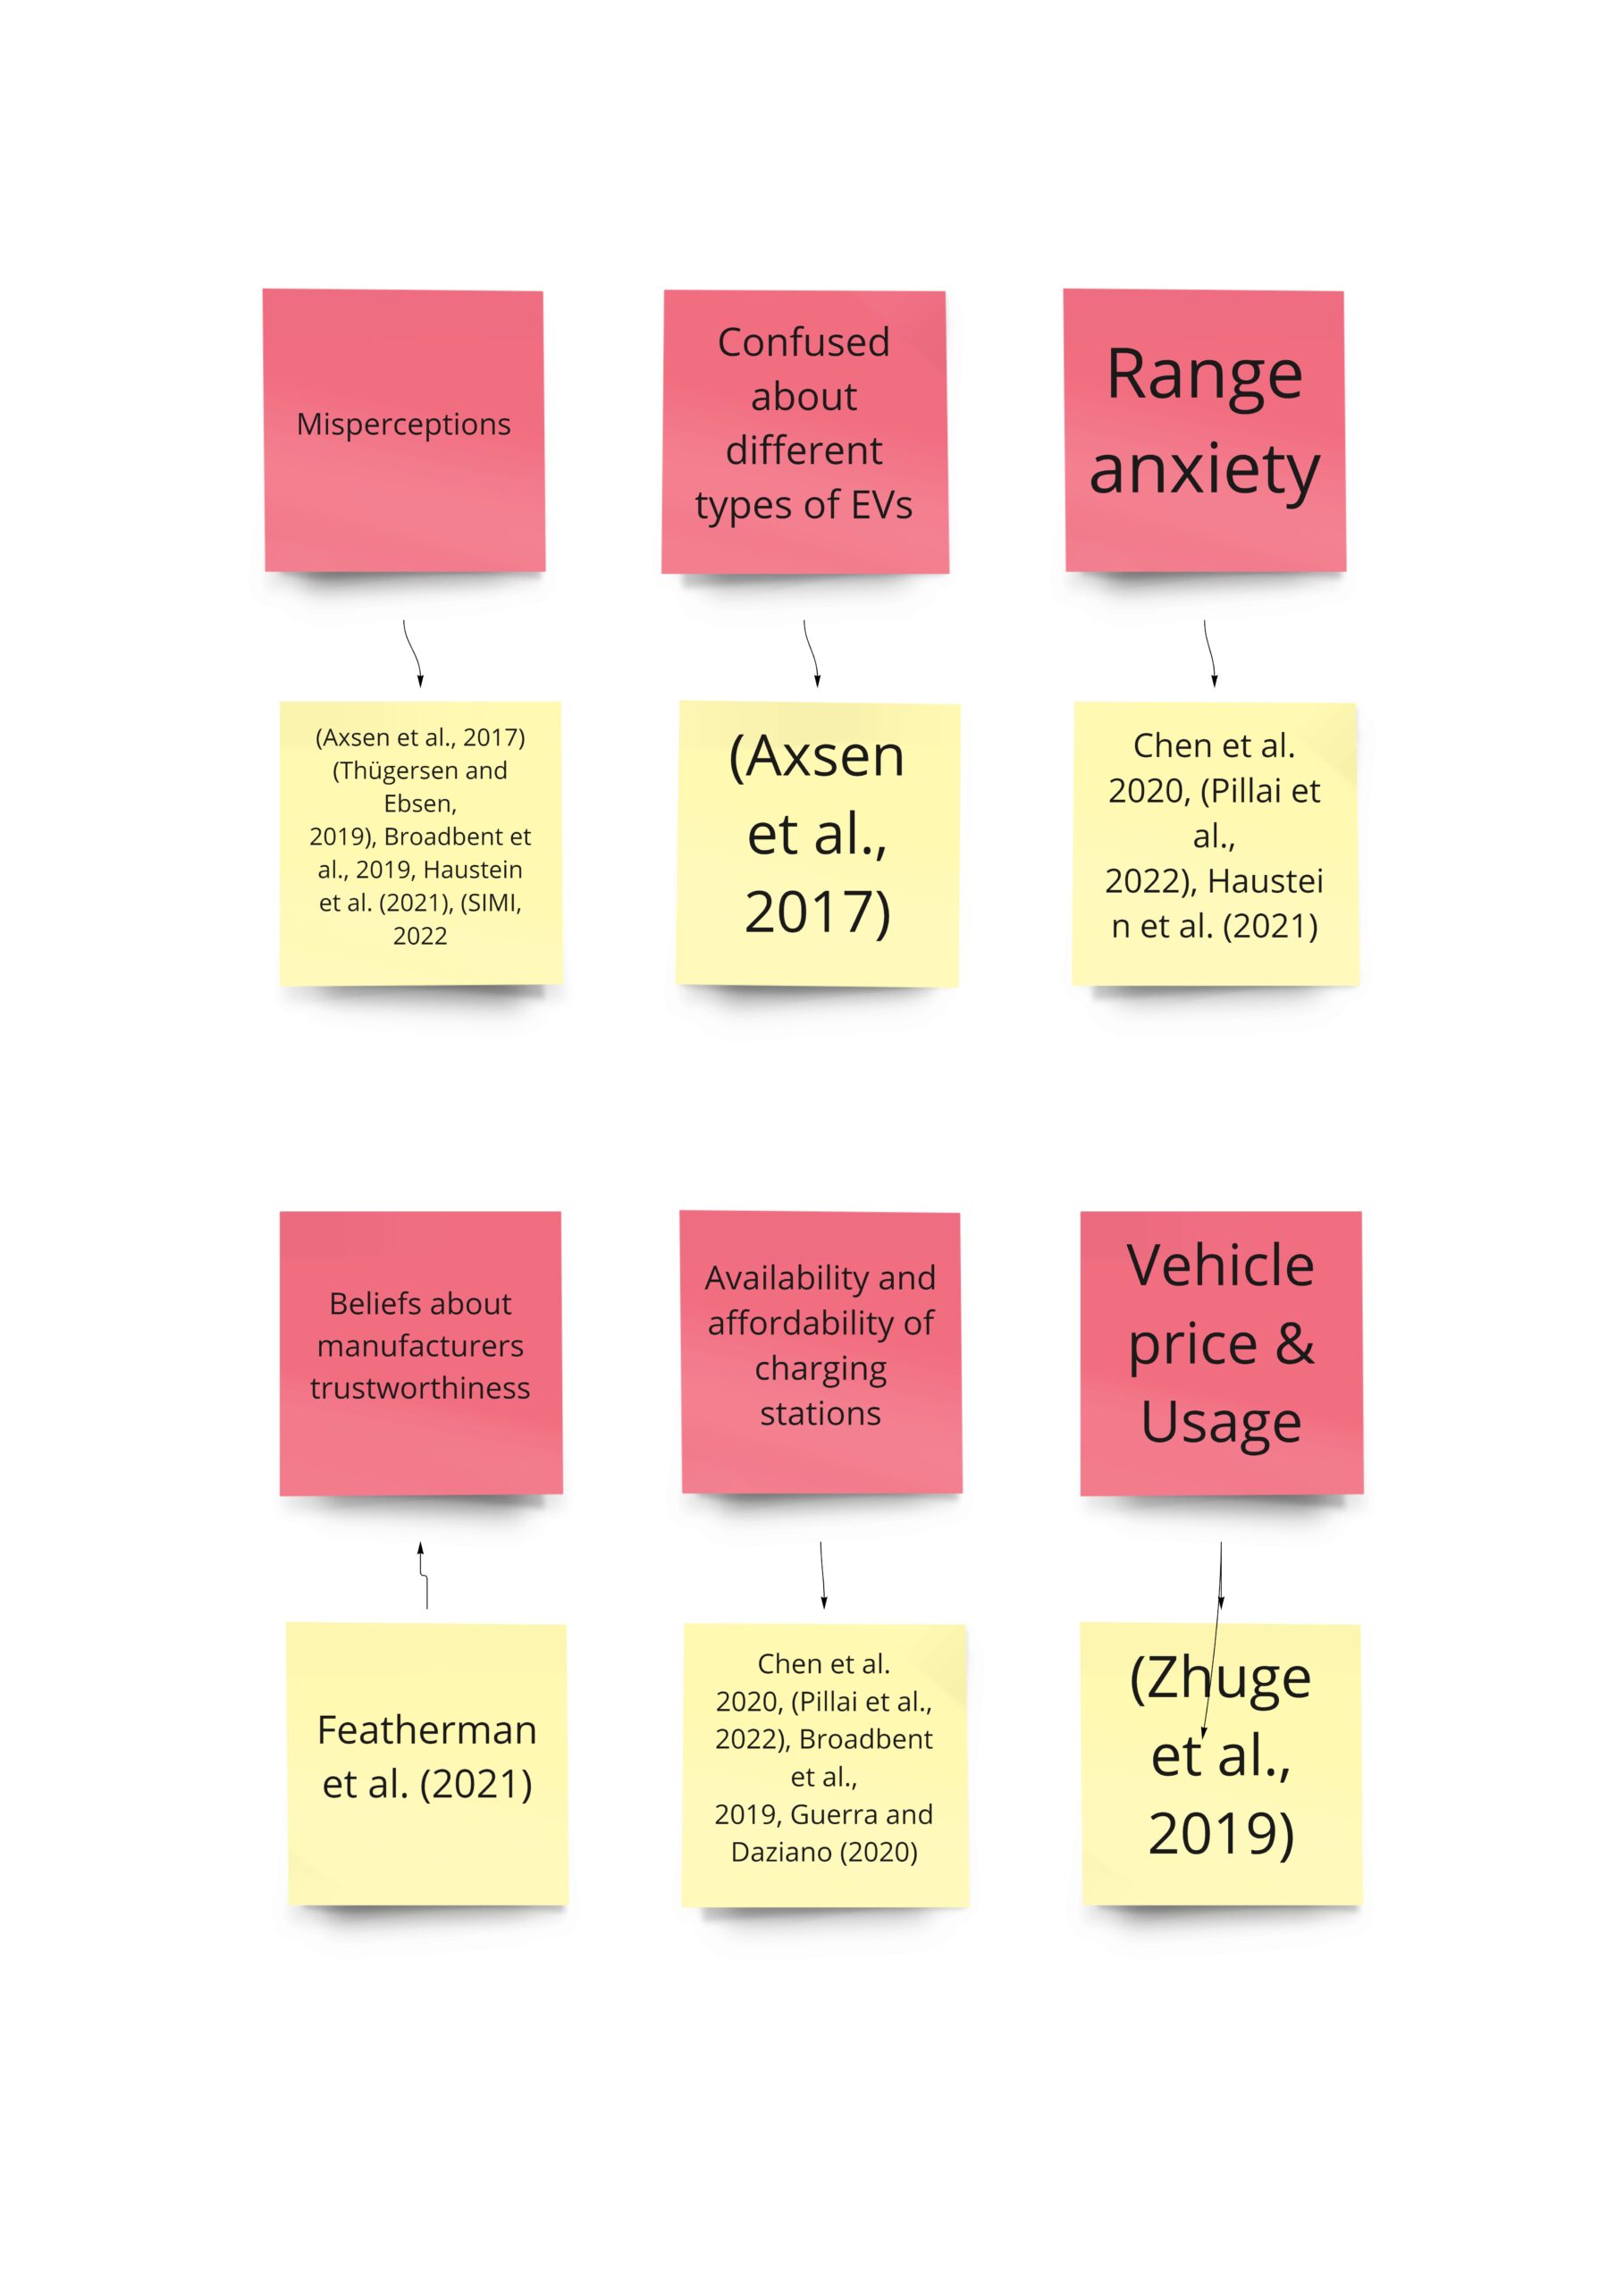
3. Painpoints experienced by EV adopters
Range anxiety, various misperceptions about EVs, confusion about different EV types, Beliefs about makers’ trustworthiness, Availability and affordability of charging stations, Vehicle price and usage.
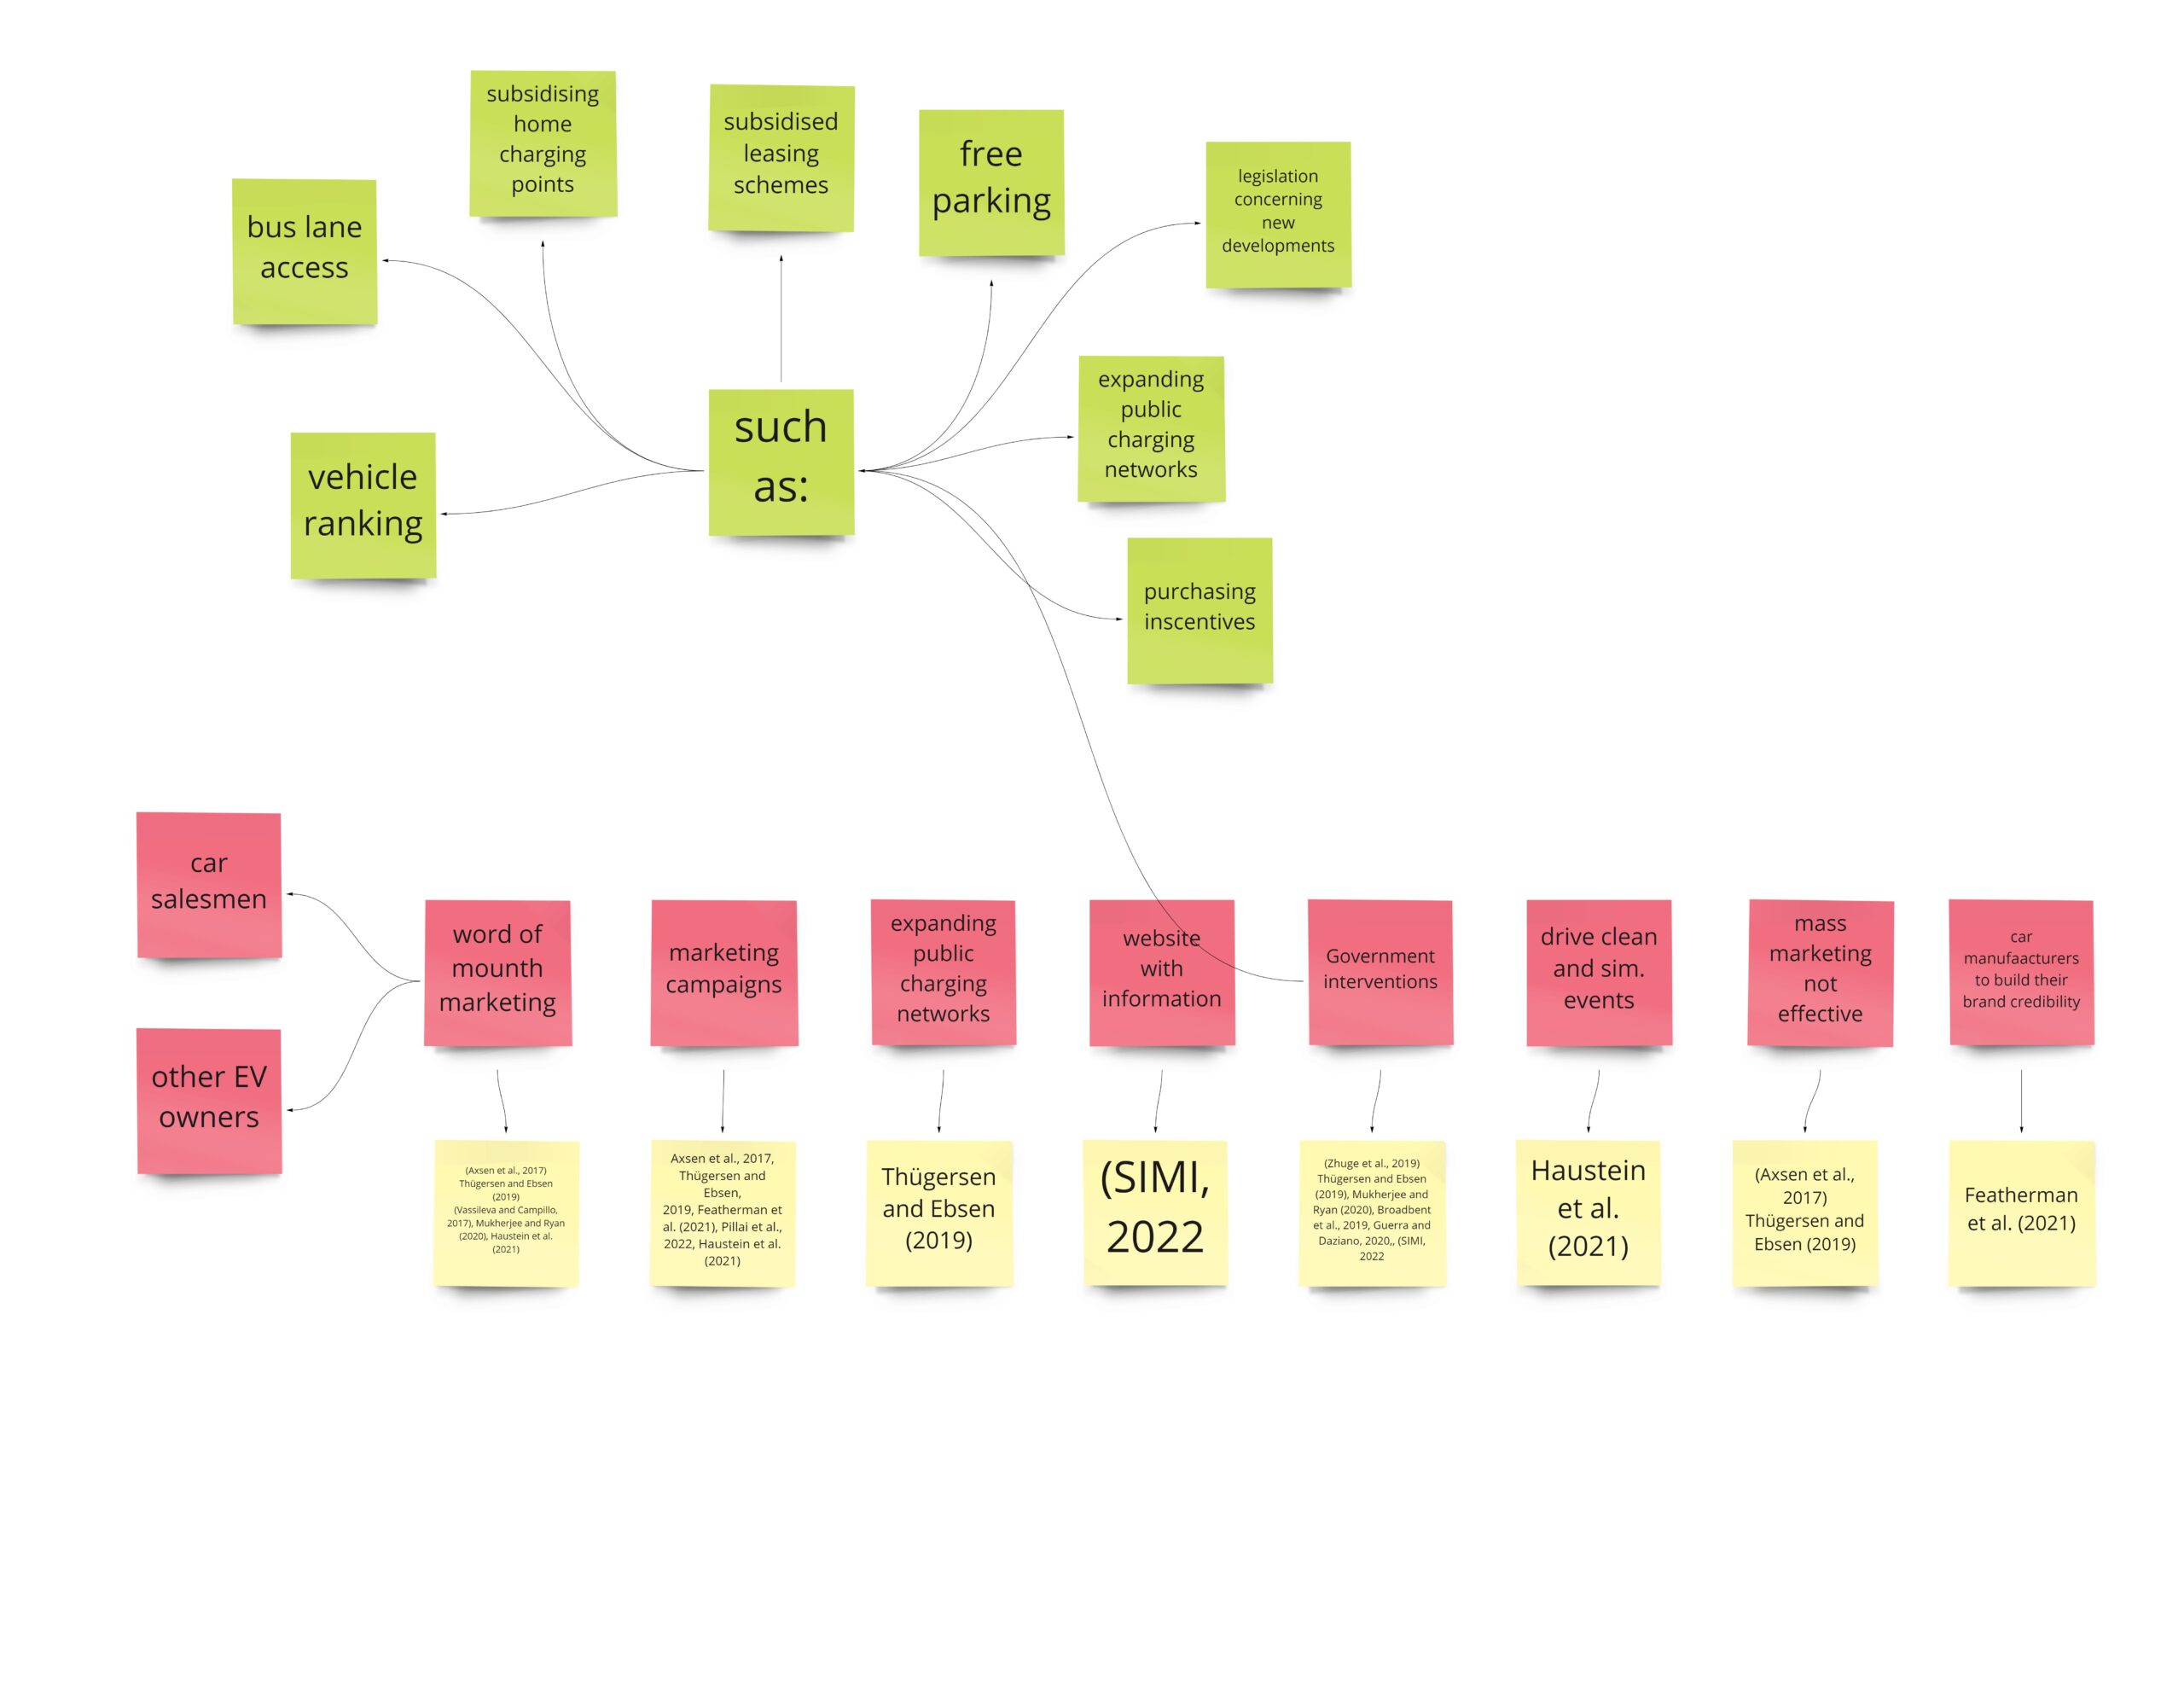
4. Existing and proposed solutions and their evaluation
Word-of-mouth marketing, advertising campaigns, expanding public charging networks, websites with information (EV Blogs), government interventions, and awareness events.
Research Hypothesis
User Research Questions
I hypothesized that it is crucial to understand people’s objective perceptions and the kind of information they lack to choose an electric vehicle.
Such knowledge would allow the designing of a solution that would help to eliminate misperceptions and contribute to faster EV adoption.
Accordingly, in the research, I attempted to figure out the following three questions:
Research Methods
What I did (and why):
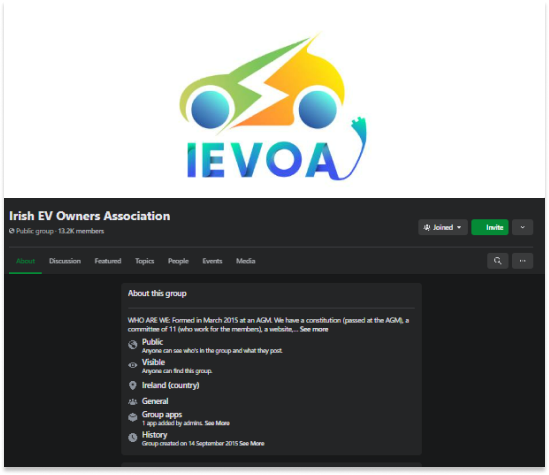
IEVOA Facebook Group
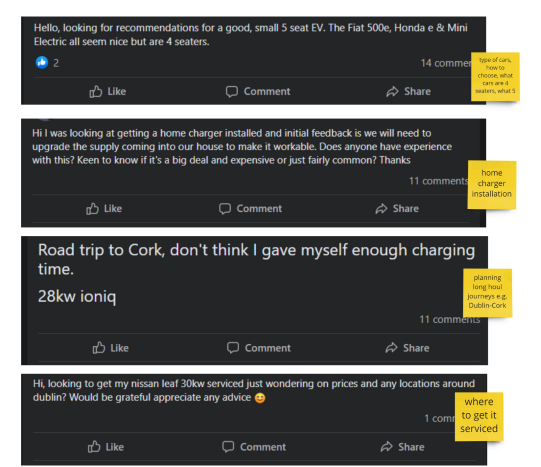
For this research, I joined the “Irish EV owners association” public Facebook group and reviewed public discussions for one month between the dates of 15/06/2022 to 15/07/2022.
Question Analysis
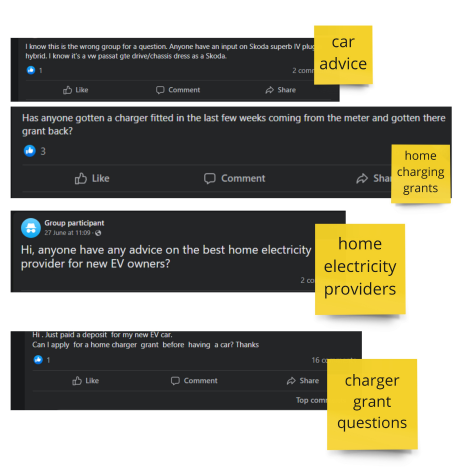
This Facebook group is for existing EV owners and people interested in owning EVs (potential owners). I noticed many people who are new to EVs join the group and ask questions related to buying their first EV (for example, a question “Hello, looking for recommendations for a good, small 5-seat EV” qualifies as a potential buyer question).
Synthesis of research
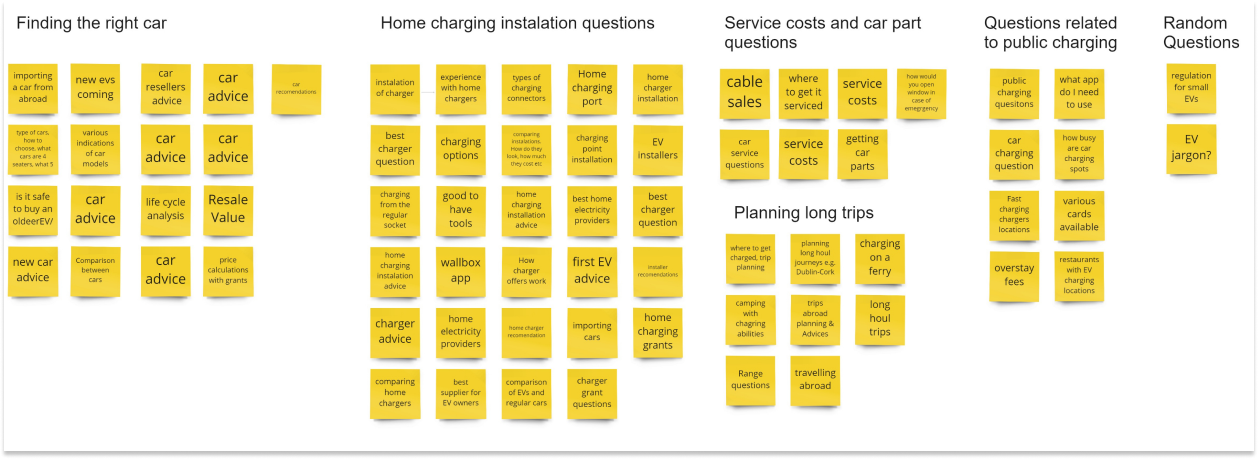
Finally, I recorded (print-screened) all threads directly related to EV adoption (questions asked by potential EV buyers). This analysis resulted in 77 questions, which gave me a profound insight into the new EV owners’ most common queries and concerns.
This analysis resulted in 77 questions, which gave me a profound insight into the new EV owners’ most common queries and concerns. To better understand the concerns and questions of new and potential EV owners, I clustered topics into an affinity diagram.
Method 2: Semi-Structured User Interviews
Participant screening
I interviewed three users who fit the proto-personas frame in the literature review.
They are all higher income, higher education individuals who drive petrol/diesel cars, own or are soon-to-be owners (User 1) of their properties and are interested in new technologies. However, none of them has owned EVs.
User Interview protocol
Each interview lasted no longer than half an hour. They were separate interviews, and I met with all three individually. I did not record the interviews using a voice recorder but took detailed notes.
When conducting the three in-person semi-structured user interviews, I had a list of questions jotted down and recorded the interviewees’ answers in a notebook. For the research synthesis part, I transferred the notes to the digital format in the form of a question followed by three answers provided by all the respondents. Similarly to the social listening analysis, I reviewed all answers to extract users’ perceptions of owning EVs. Again, I jotted down the insights on sticky notes.
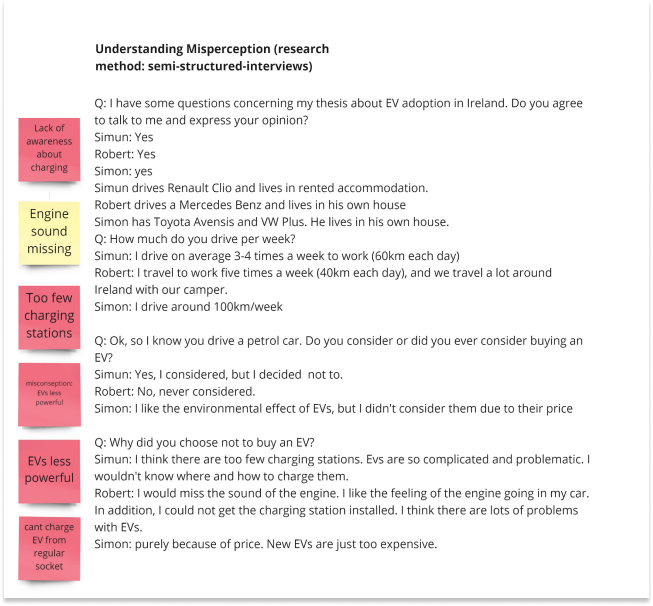
This exercise resulted in 18 sticky notes depicting interviewees’ perceptions, pain points and false beliefs about owning EVs. Like in the social listening phase, I analyzed the results using the Affinity diagram. I split the results into broad categories and calculated their popularity by the times they were mentioned in the interviews:
Method 3: Perception Survey
Finally, I ran an online survey using Google Forms. I listed various perceptions discovered while conducting the literature review and the semi-structured user interviews in the survey. I clustered the perceptions and categorized them into the following categories of beliefs:
I received 33 responses to the survey. 50% of the respondents identified themselves as female, while 50% as male. Most respondents, 63.3%, are 30-45 years old, 21.2% are 46-60 years old, and the rest are younger than 30.
Survey Analysis (I)
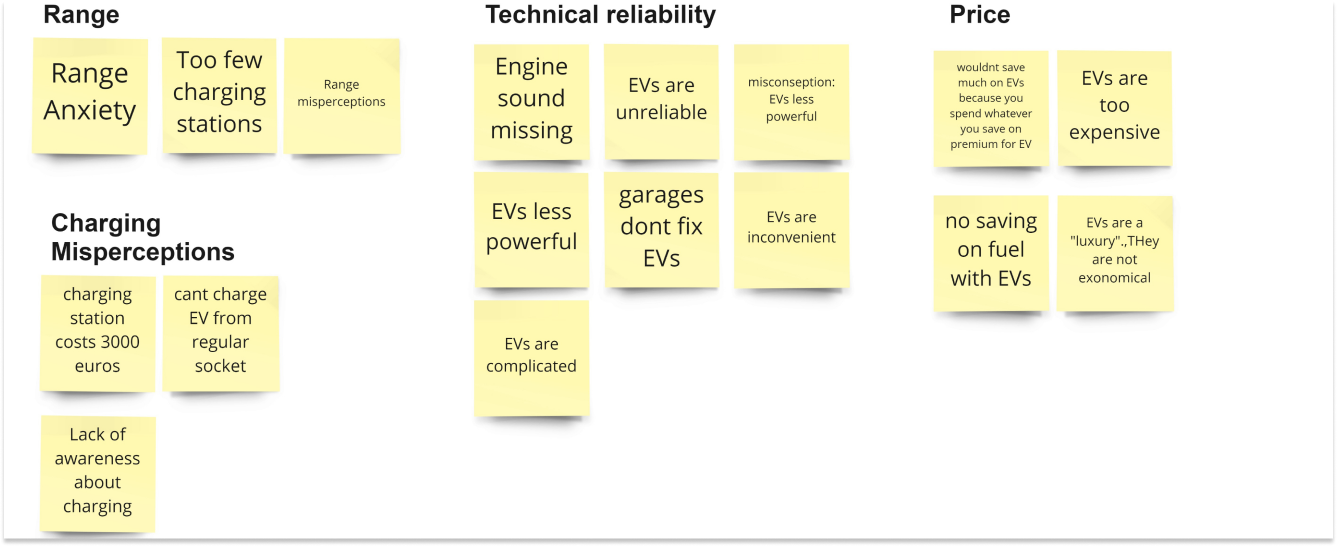
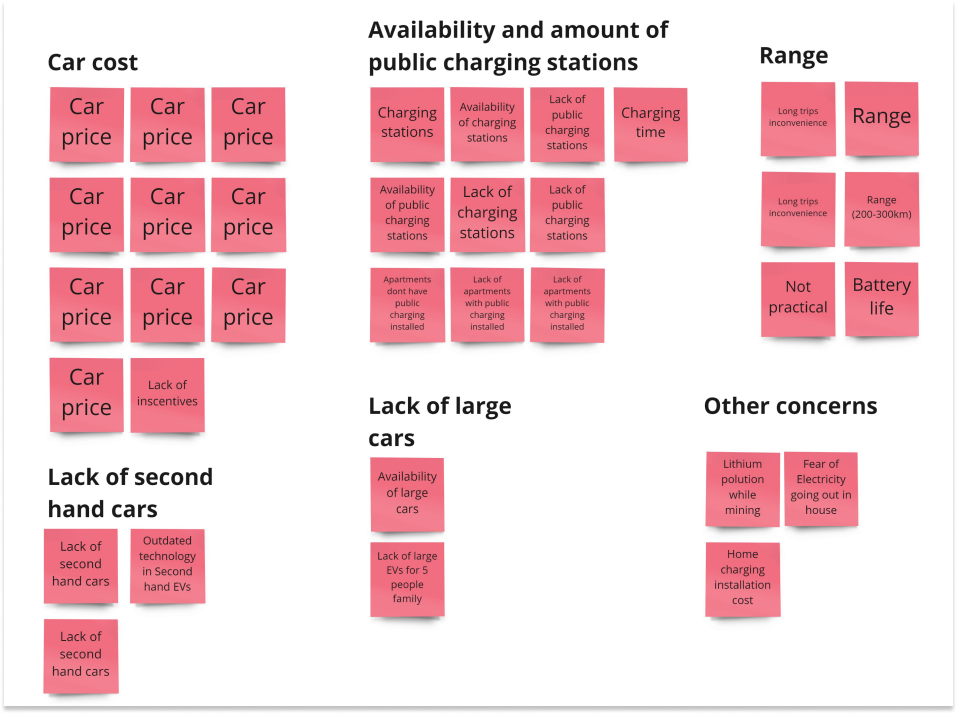
I set to analyze the survey results. The analysis this time consisted of two parts. Firstly, I examined the responses to the last open-ended question of the survey. This question asked what would put the respondent off from buying an EV.
By asking this last question, I was hoping to figure out respondents’ personal anonymous opinions towards EVs and some additional perceptions that I hadn’t included in the survey.
Again, I summarized their answers in the affinity diagram, which resulted in the following categories:
Survey Analysis (II)
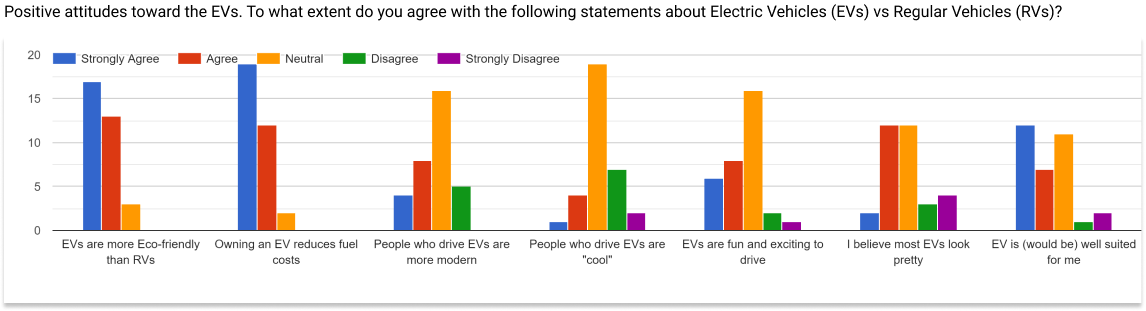
As a second part of the survey, I asked respondents to evaluate statements using Likert scales ranging from “Strongly Agree” to “Strongly Disagree”. Here is an example of one of the questions (with answers):
Perception ranking mechanism
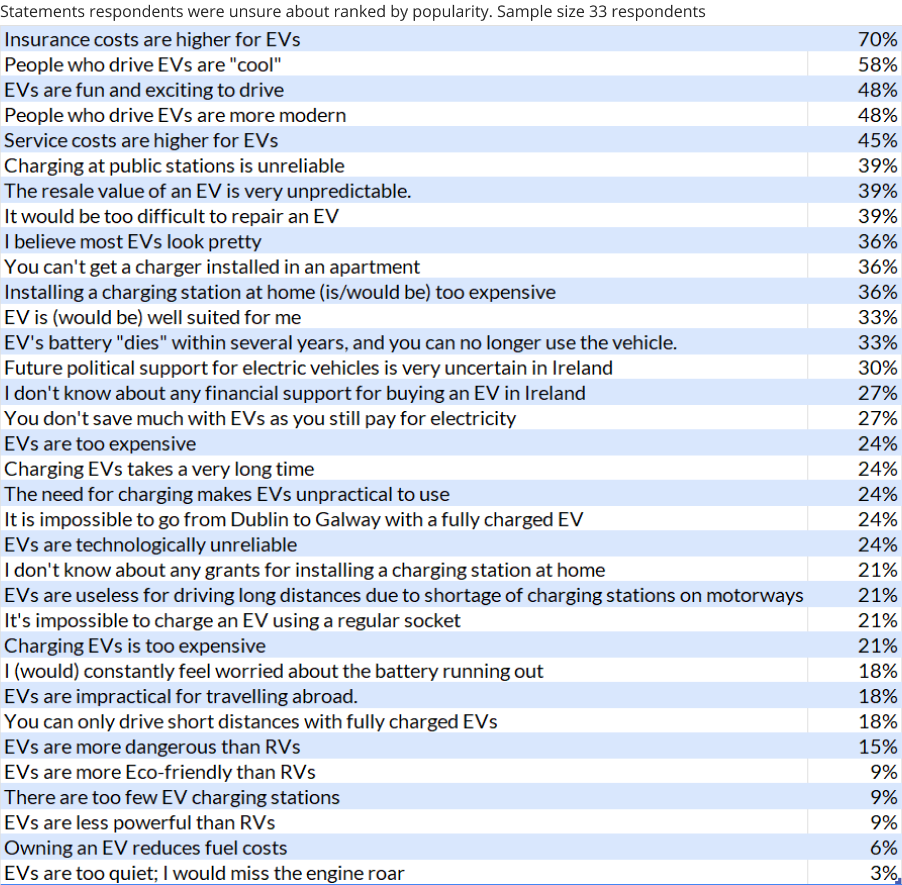
The purpose of this survey was to determine the perceptions people have about driving EVs. I wanted to know the most popular positive and negative perceptions as this data could influence ideas for the solution. I downloaded the CSV files from Google forms and employed Excel analysis to rank the perceptions by their popularity. In addition, in the survey instructions, I requested respondents to leave the question black if they were unsure or didn’t know the answer. Therefore I set the third-ranking that showed aspects of EVs people didn’t know/were not sure about or don’t have an opinion about.
Perception Survey Interpretation & Conclusions

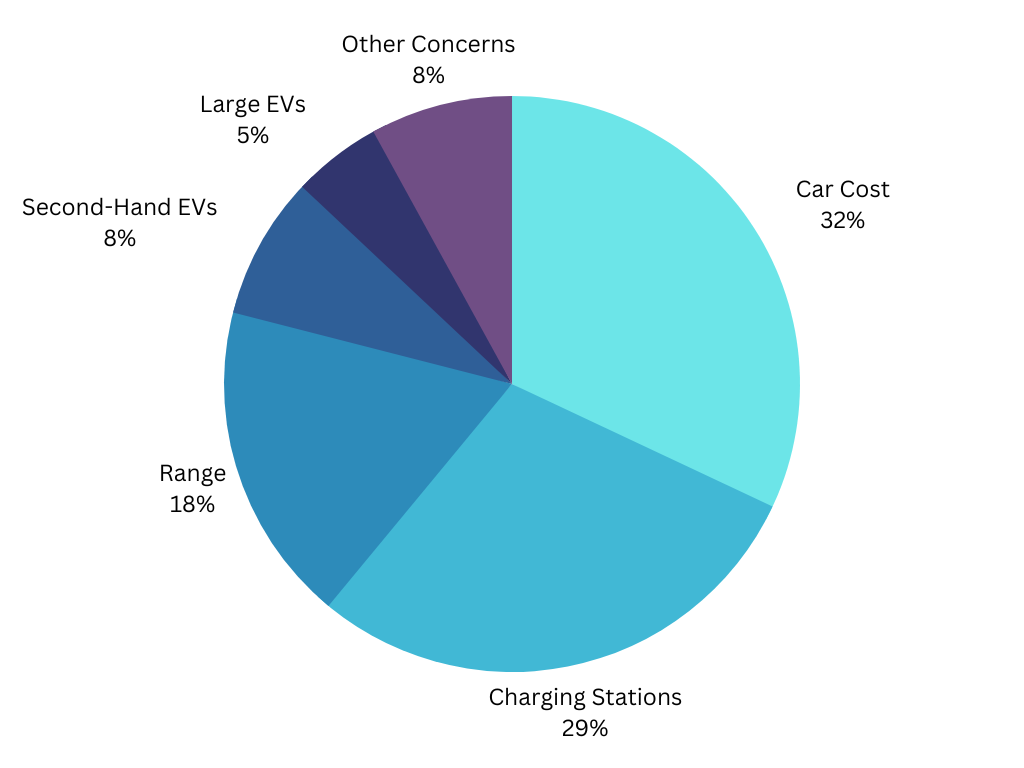
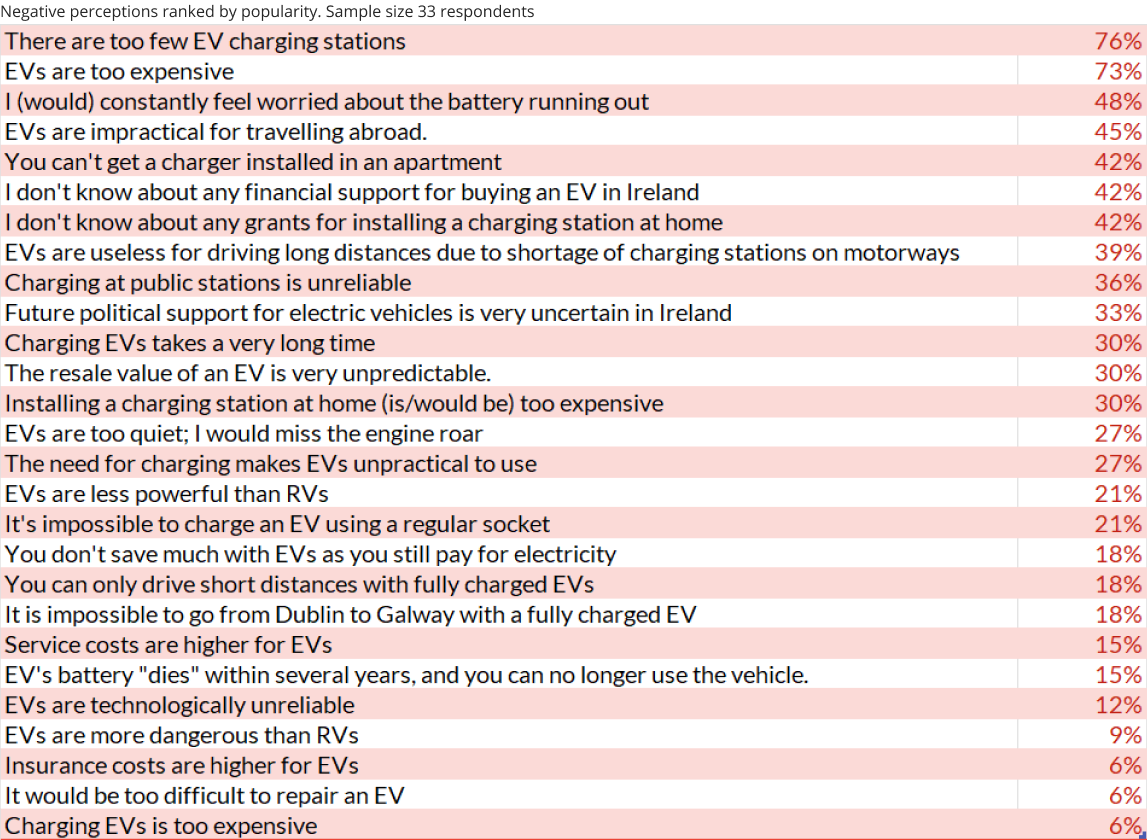
Negative perceptions
Survey results showed the three most popular negative perceptions are related to:
People are also concerned about taking their EVs abroad (45%) and the possibility of installing charging in the apartments (42%).
Interestingly a large chunk of respondents didn’t know about government grants for buying EVs or installing charging sockets at home (42% respectively).
This data shows that the marketing messaging should focus on increasing public awareness about the new public charging stations installed and debunking the myth of EVs not being suitable for long trips and trips abroad.
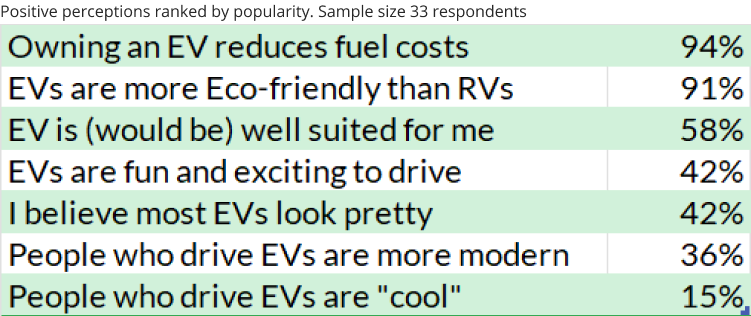
Positive perceptions
The positive beliefs analysis shows that generally, respondents agree with the statement that owning EVs reduce fuel cost (94%) and that EVs are more Eco-friendly than regular cars (91%). Hence, spending funds to push the “eco-friendliness” of EVs and savings on fuel costs may not be adequate.
Overall marketing messaging should focus on reliefs and additional benefits of EVs that are still unknown to the public and try and focus on long-term comparisons between EVs and regular vehicles.
Moreover, the public should hear more about new EVs coming to the market and the changes in EV technology, as the research data shows an evident lack of awareness regarding those questions.
Stakeholder Analysis
Finally, to fully understand the scope of the problem, I wanted to consider other stakeholders involved in EV adoption in Ireland.
A stakeholder map is significant in the ideation process because it helps to determine the players and elements that influence the problem.
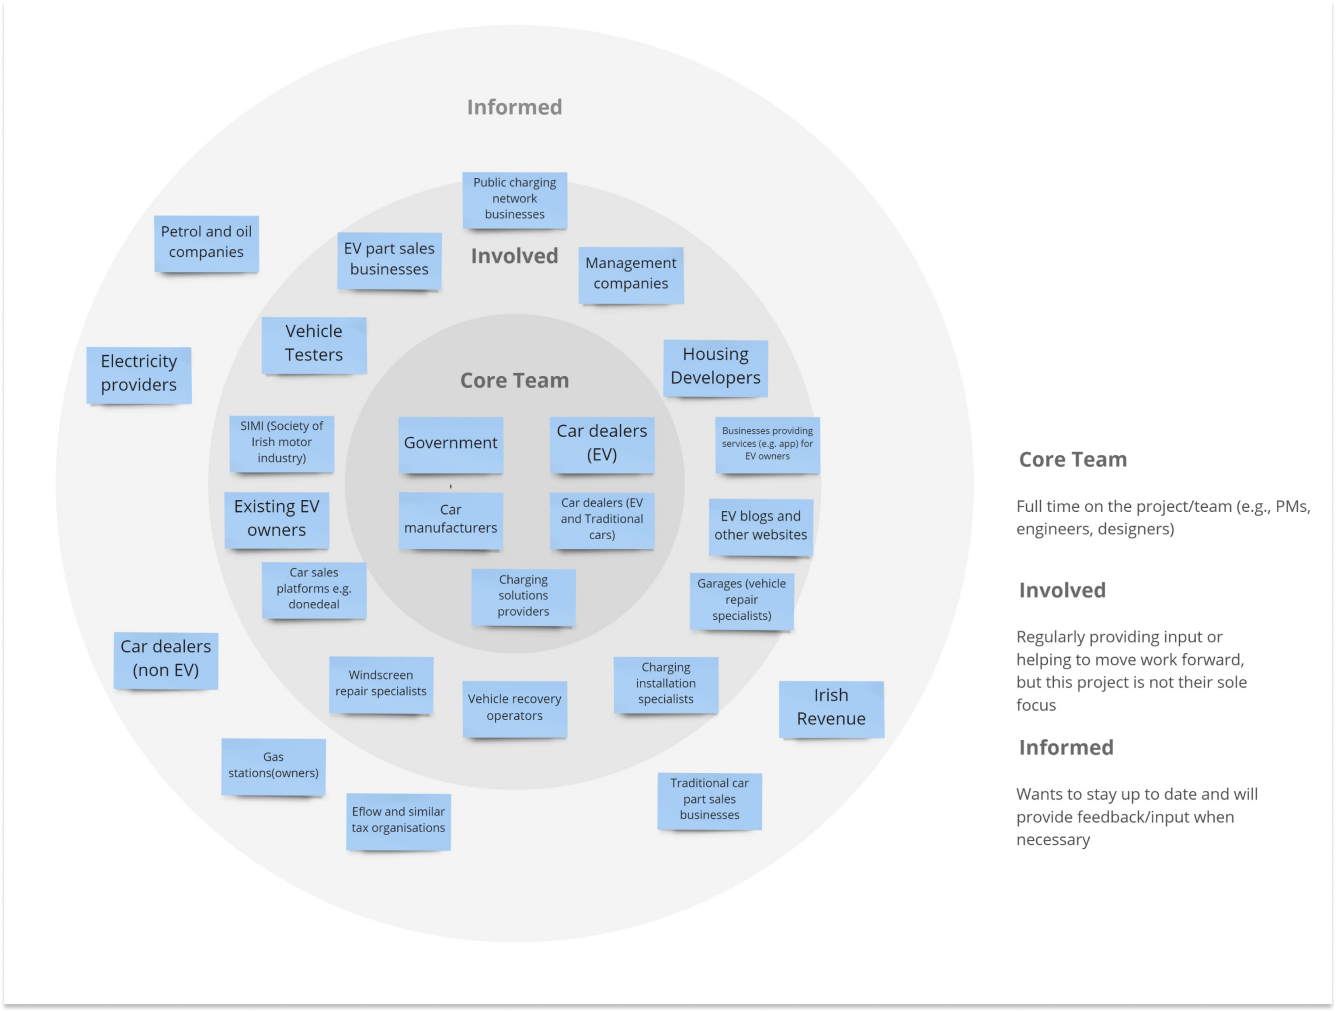
At its core are EV manufacturers, car dealers, charging solutions providers and the government.
The involved parties are the existing EV owners,
public charging network businesses, EV part sales businesses, vehicle testers, SIMI (Society of Irish motor industry) and various other transport organisations, car sales platforms (e.g. Done Deal), Windscreen repair specialists and others.
In the “informed” section are petrol and oil companies, electricity providers, non-EV car dealers, gas station network owners, E-Flow and similar tax organisations (as well as parking operators), traditional car part sales businesses and others.
DEFINE (SYNTHESIS)
IN THIS SECTION:
1. Building User Persona
2. User Personas (Based On User Research)
3. Persona Matrix
4. Customer Lifecycle Changes
5. Persona Goal Setting
6. Key Drivers Of Electric Vehicle Adoption
7. User Journey Map “As Is” & “To Be”
8. User’s Journey Through Customer Lifecycle Stages
9. User’s Experience Map
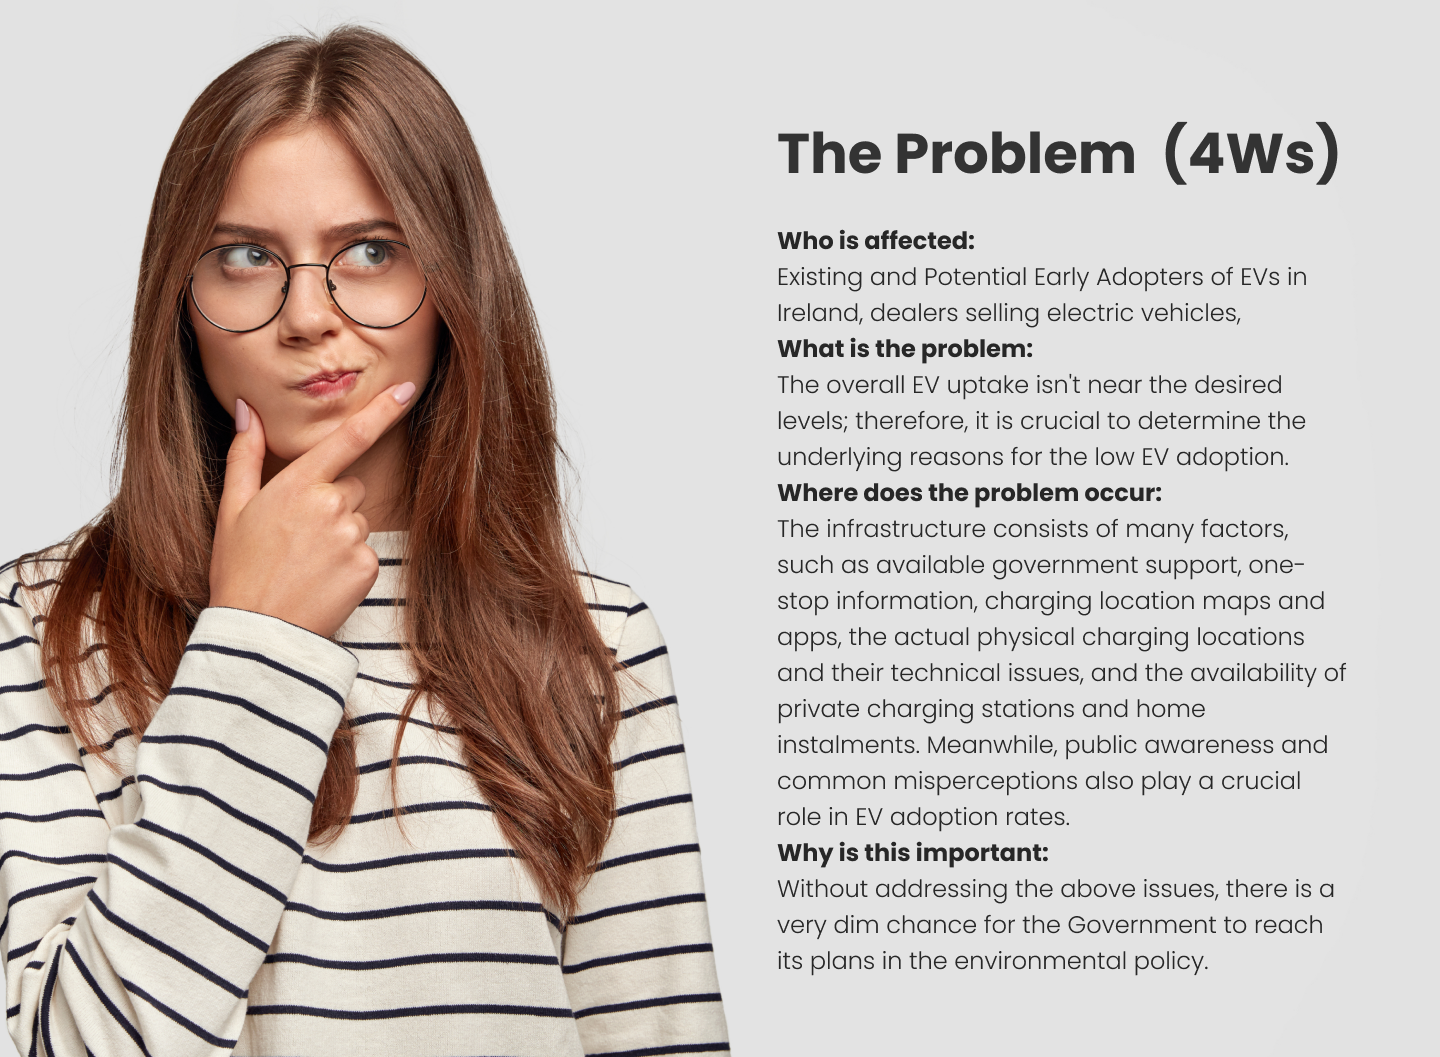
10. Defining the User’s Problem
11. “How Might We” Statement
COMING NEXT:
DEVELOP(IDEATION)
DELIVER(IMPLEMENTATION)
PREVIOUS SECTION: DISCOVER (RESEARCH)
TO THE BEGINNING
TO THE END
User Persona Framework
Potential EV buyer’s framework research
In November 2019, Deloitte surveyed almost 1500 UK residents considering purchasing a car in the next three years. As a result, it came up with a potential EV buyers framework. They based this framework on current car ownership, age, and monthly spending on a car or if bought outright.
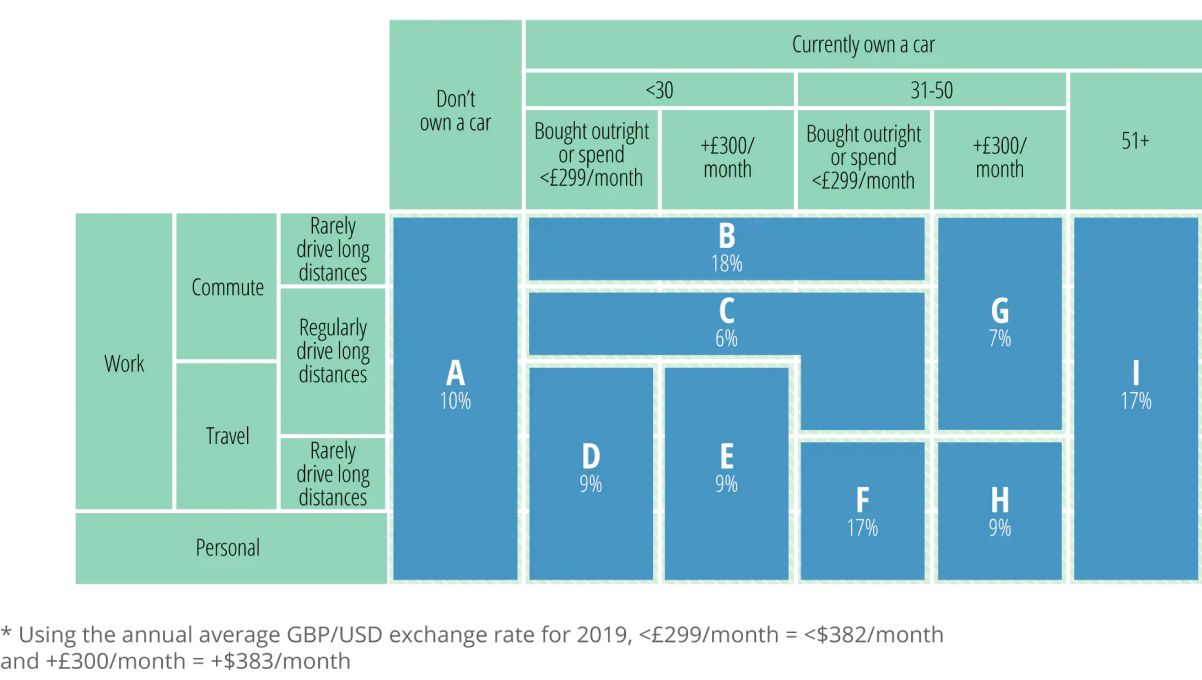
In addition, they analyzed the primary use of their vehicle, which is a further breakdown by personal service and long-term trips. In addition “how the car is used for longer trips” factor was also incorporated into the framework. After reviewing their survey results, they developed potential EV buyers’ segments, which are depicted on this page.
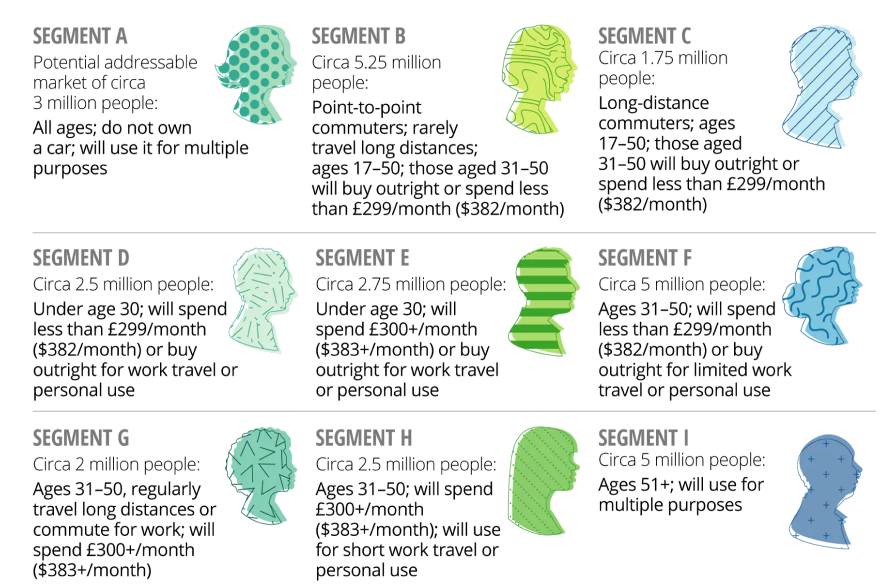
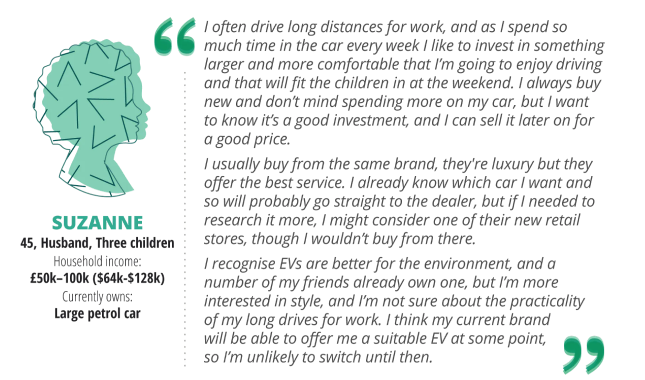
Deloitte’s analysis allowed them to develop some examples of detailed potential EV buyers’ profiles. The individual profiles are derived from a comprehensive study of survey data and further qualitative research. Each one depicts a typical consumer in a specific market area, identifies their essential traits, and then uses the simplified data to discuss ways that persona might be specifically targeted.
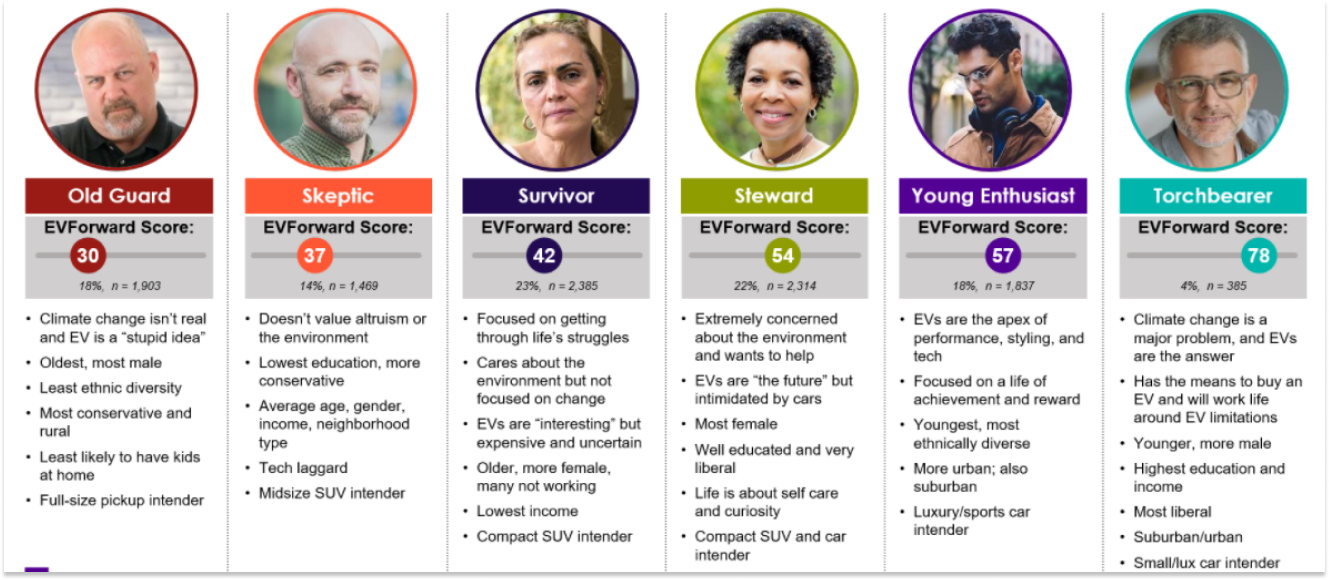
Meanwhile, the award-winning US advisory firm Escalent, after surveying 10,293 new vehicle buyers aged 18-80, developed a spectrum of vehicle buyers’ portraits on their attitudes towards EVs. They distinctively categorized them by their EV acceptance level, with the “Old guard” being the least accepting and the “torchbearer” being the most accepting:
Persona map framework
As my next step toward creating user personas, I used the User persona map framework, originally borrowed from the business analytics world.
I used this model to make more sense of the research data from the literature review, social listening, user interviews and user surveys. My research resulted in some sticky notes depicting various aspects of potential EV owners. I used the pixelresearchlab template on Miro Boards to categorise and analyse the collected data.
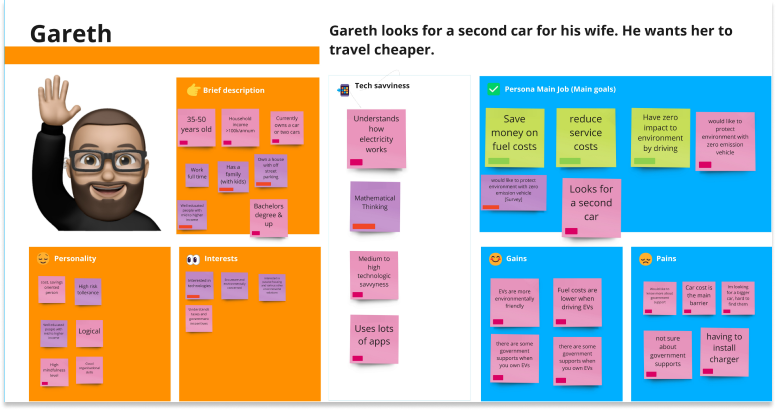
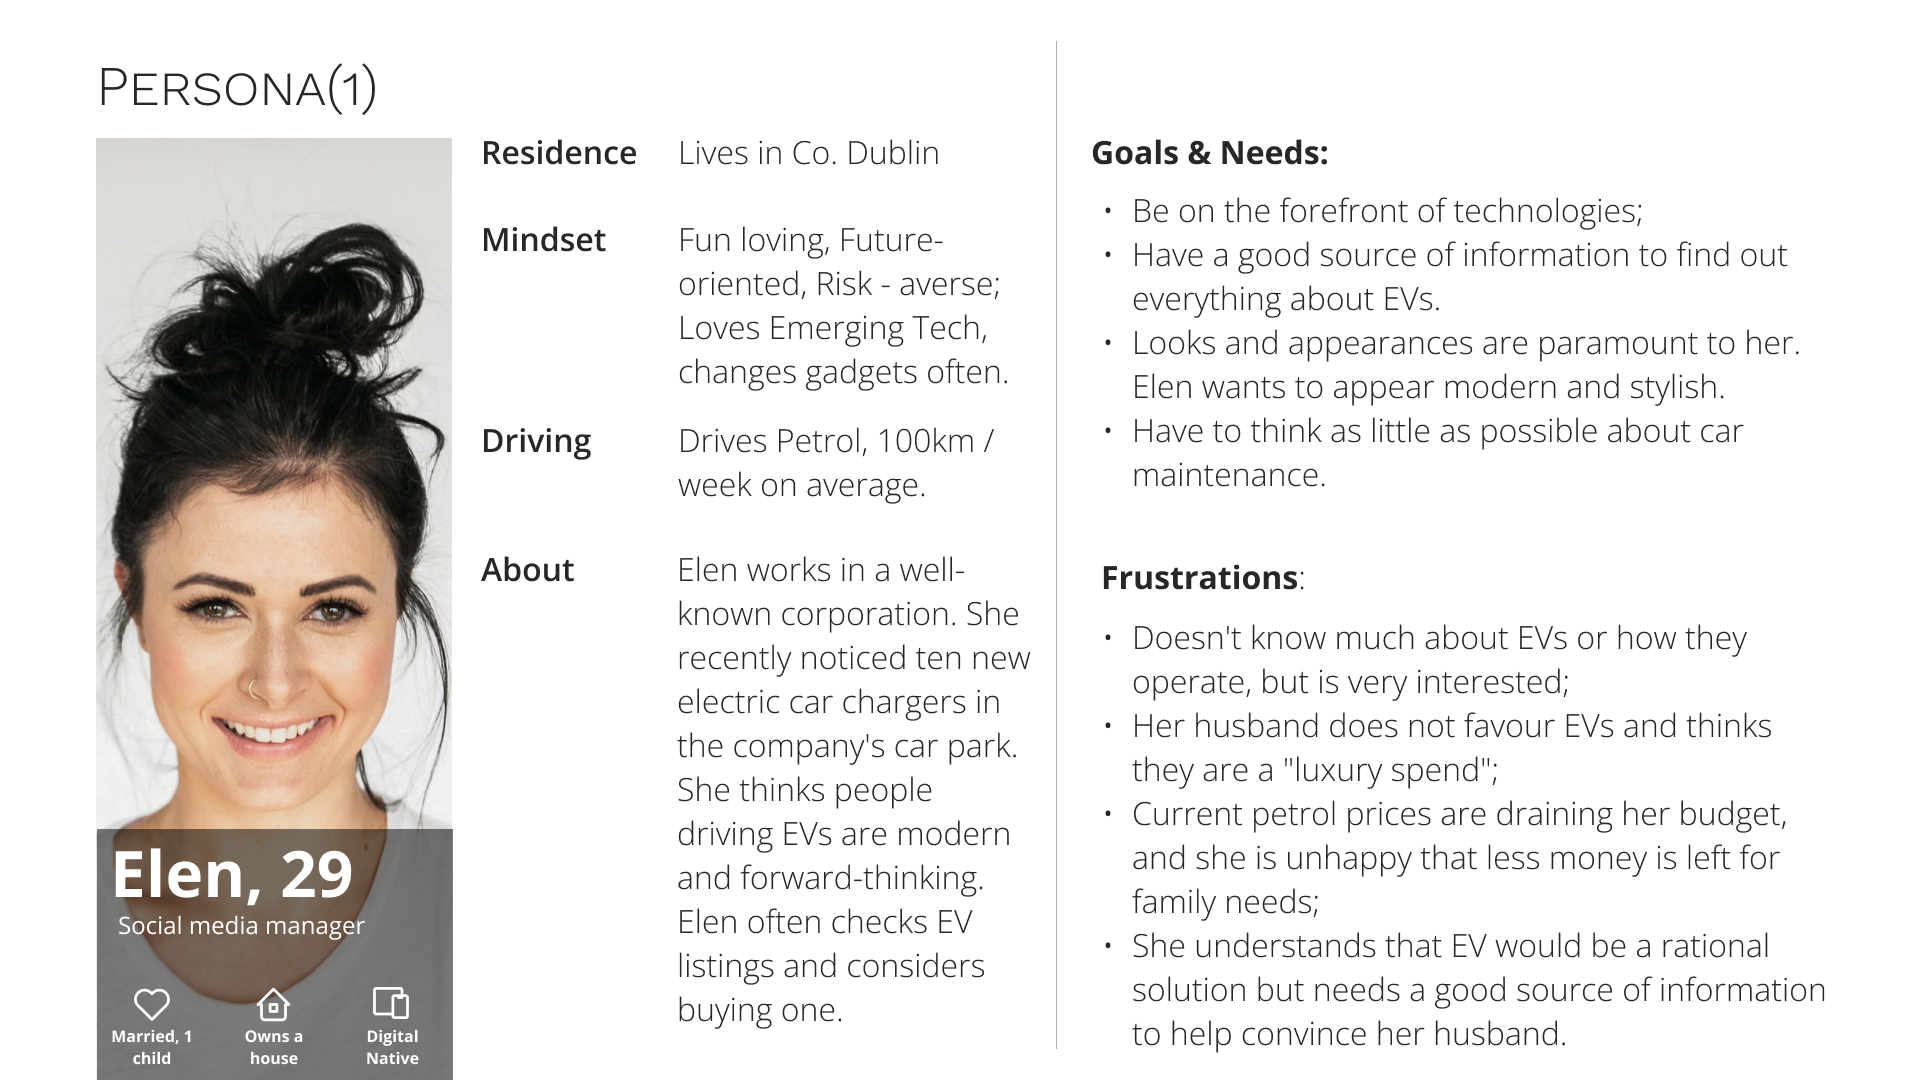
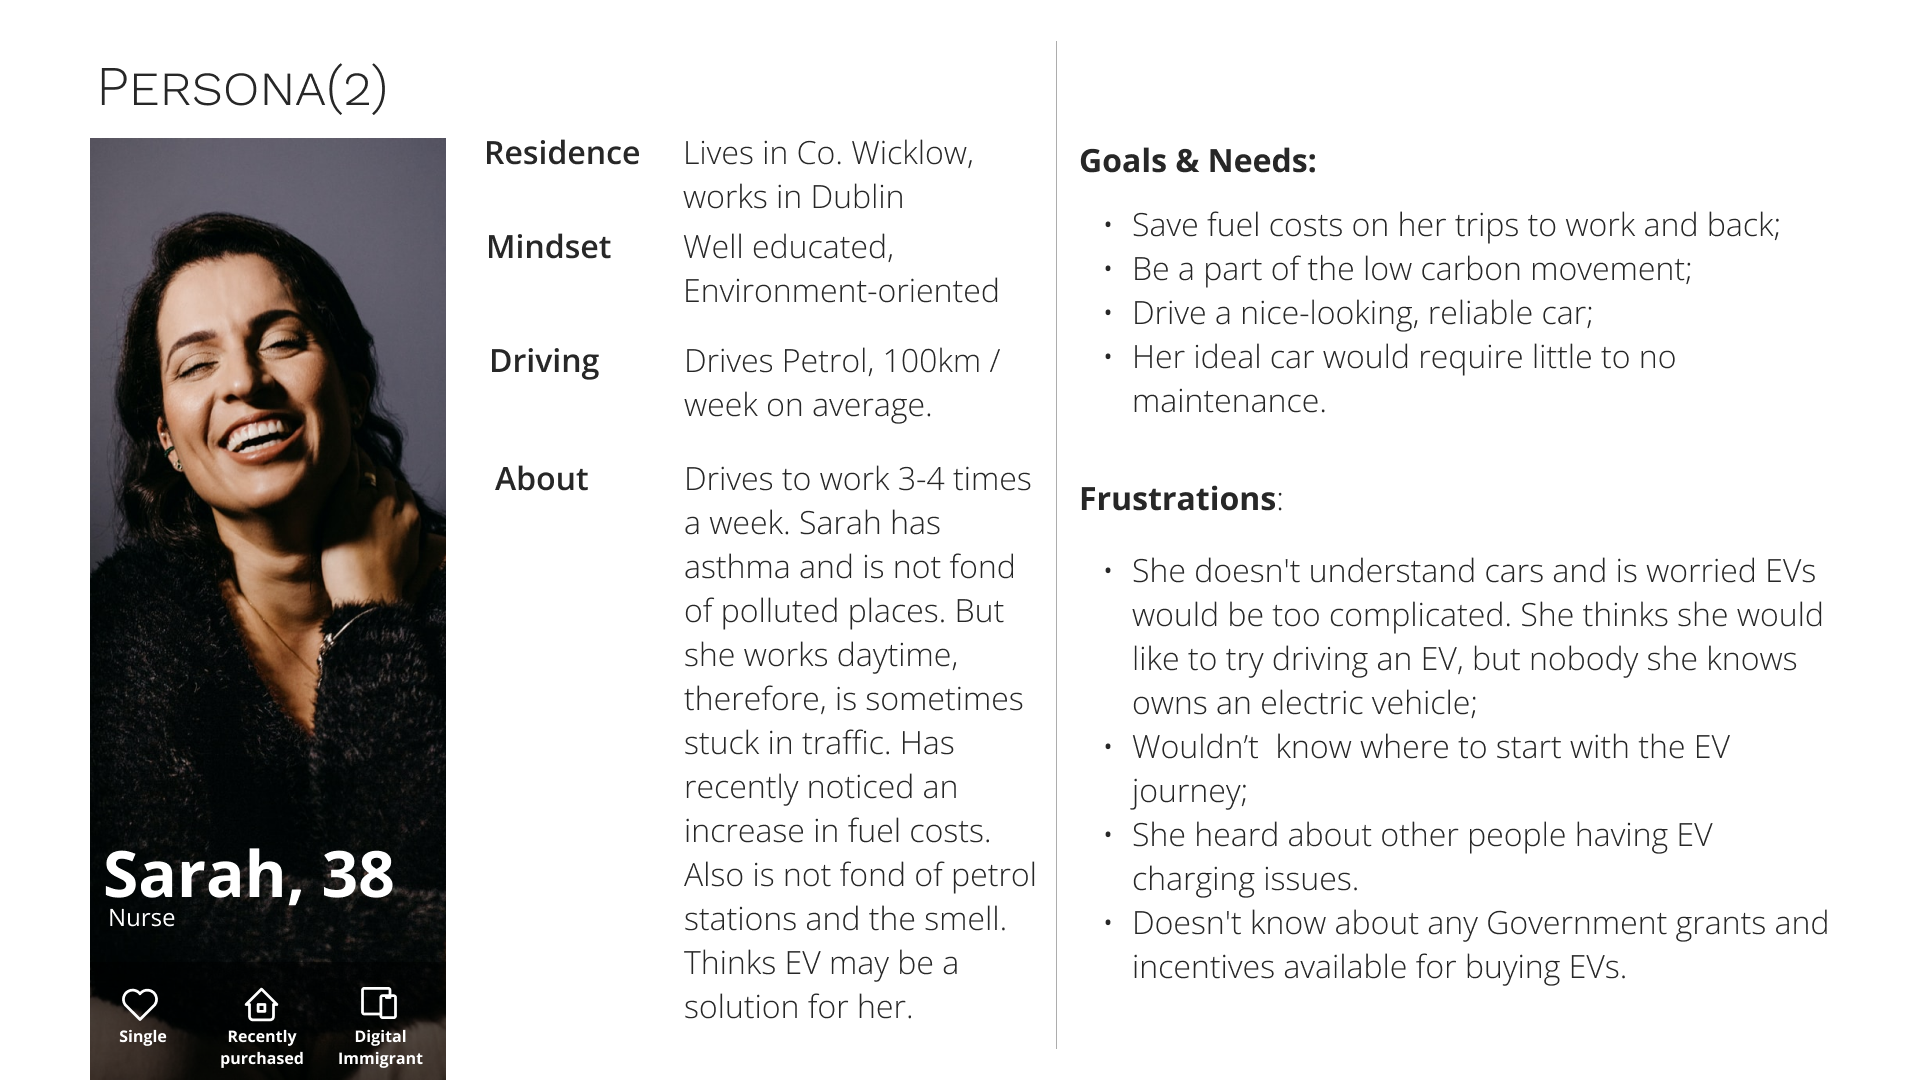
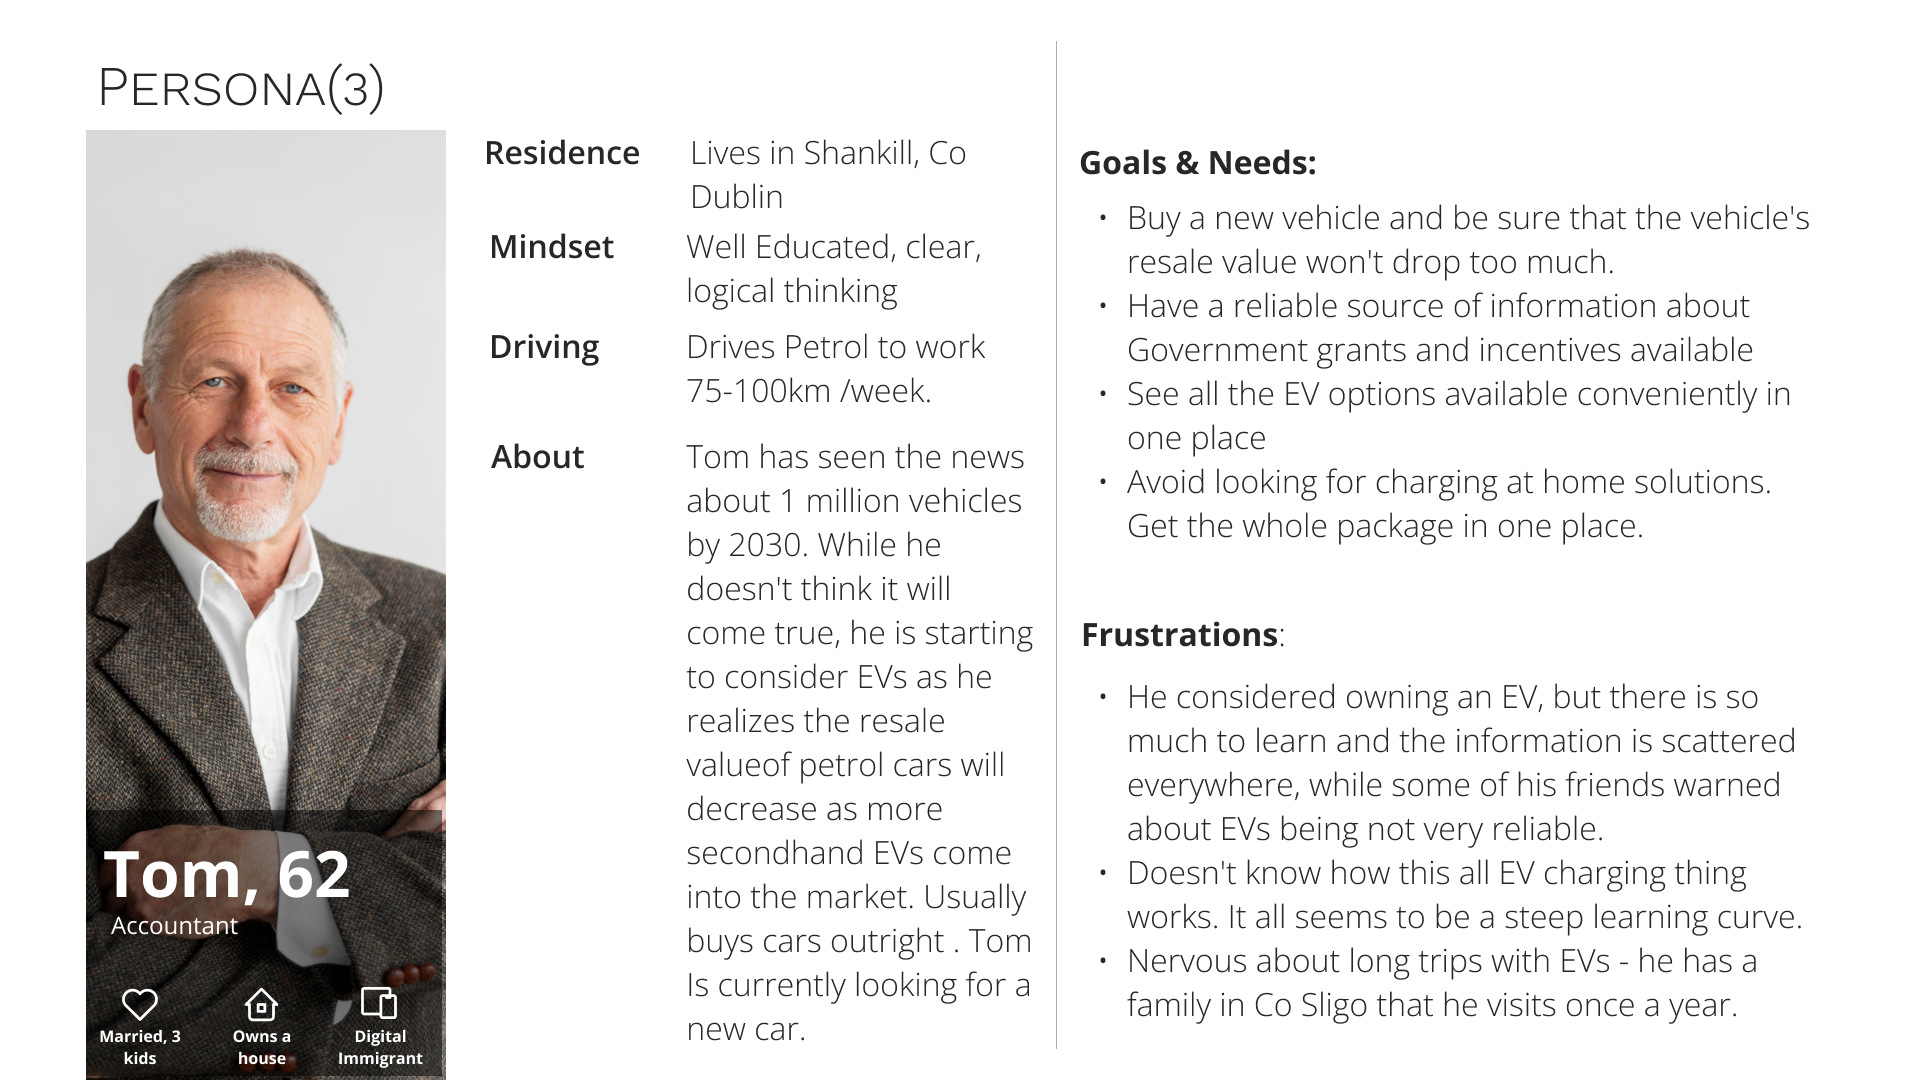
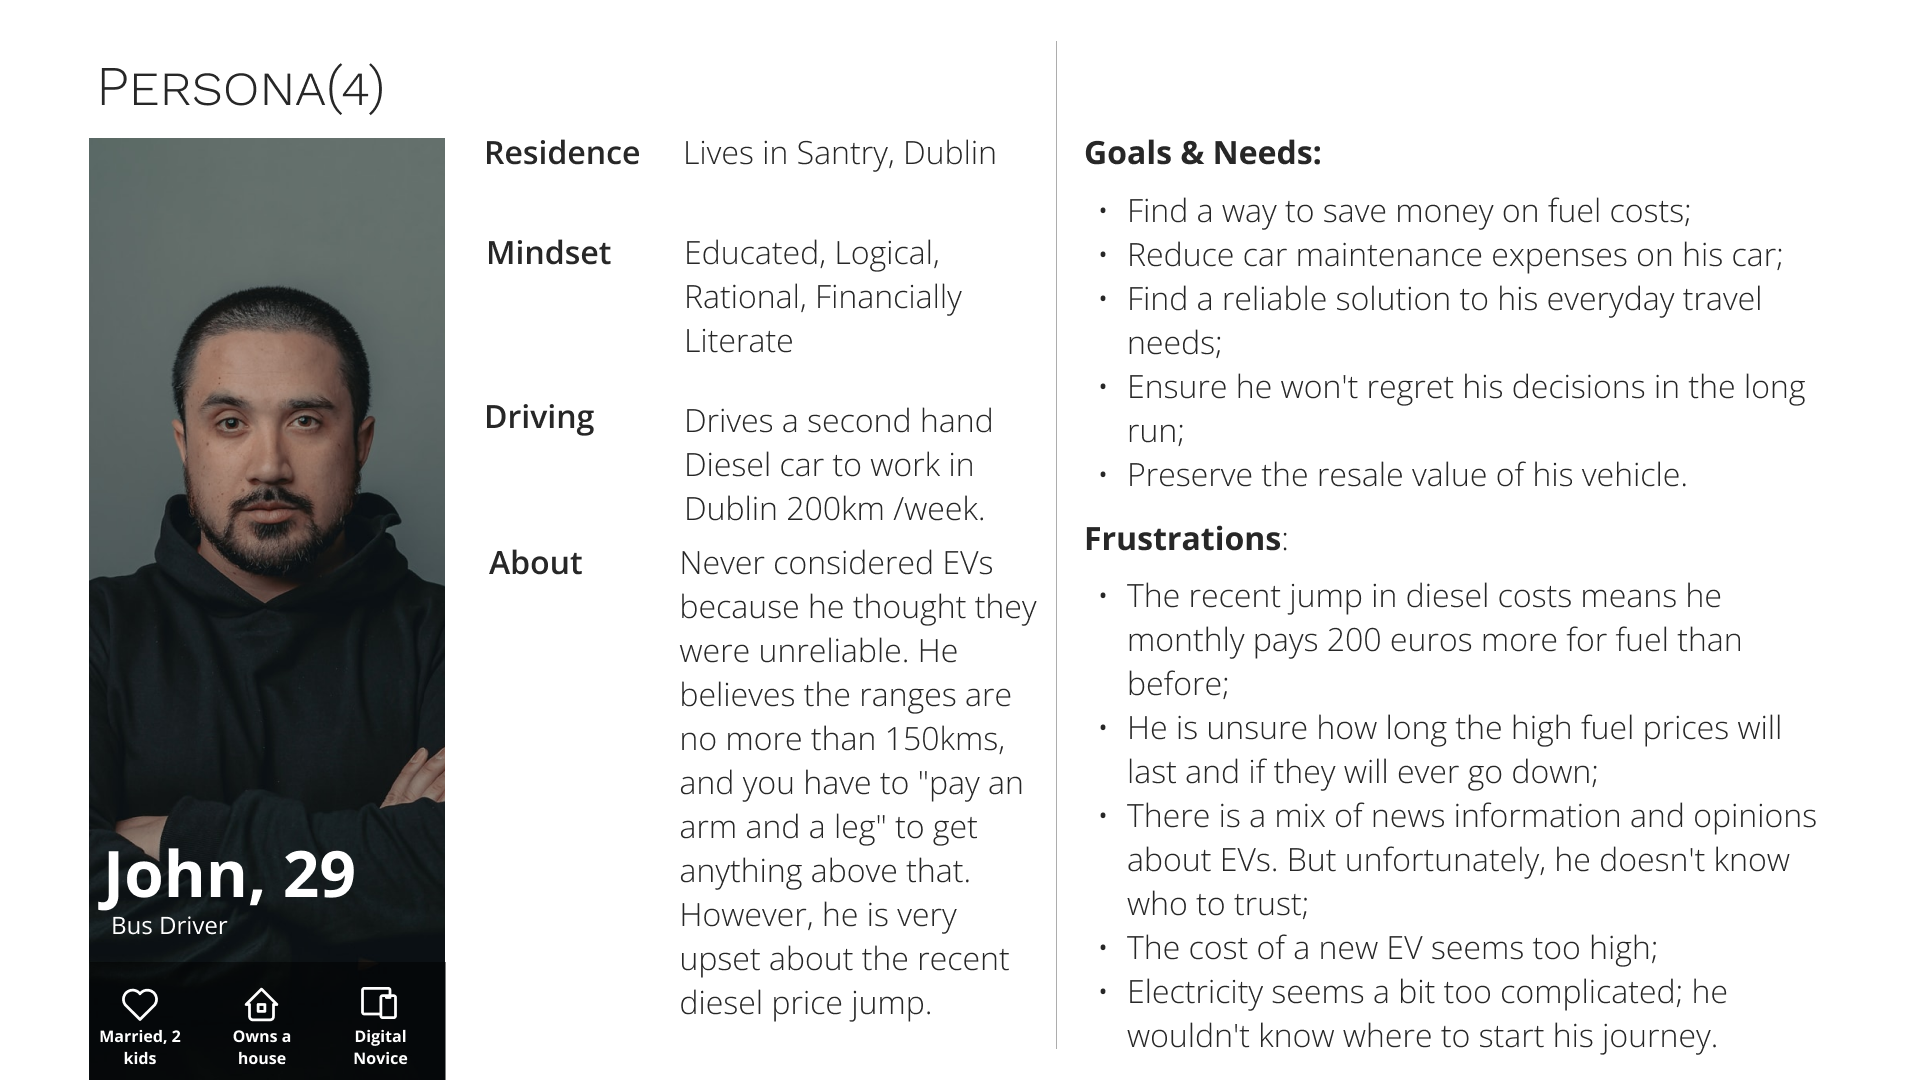
User Personas (Based On User Research)
Persona Matrix
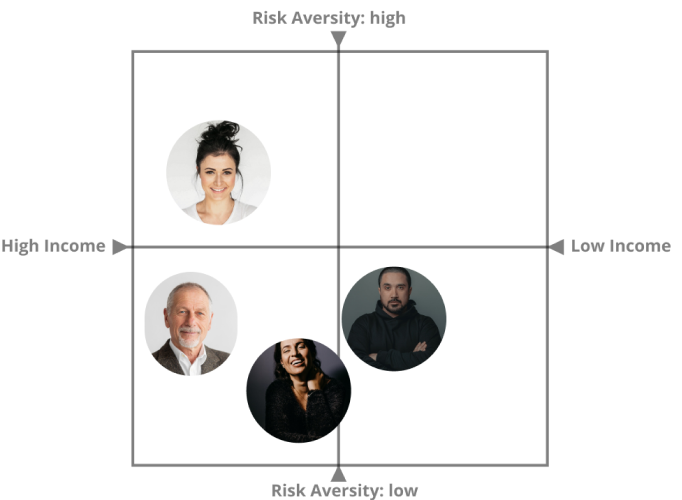
I used the Persona Matrix to understand and analyse the personas’ willingness to take risks and income level.
Moreover, the literature review and my research often suggested that statistical EV adopters are higher-income individuals interested in new technologies and willing to take risks with them.
However, in this case, most personas can be found on the bottom half of the grid because my research shows that most potential EV buyers who haven’t bought EVs yet are on the low-risk-aversion side. In other words, they still believe in the misperception that EVs are technologically unreliable and that it is better to wait another few years before buying them.
Customer Lifecycle Changes
Finding a UX solution to the low EV adoption rates requires understanding the various types of users and having deep insight into the journey they would have to undertake, from being completely unaware of EV technologies to owning an EV. The Customer lifecycle stages concept borrowed from the innovations marketing industry helps to map and understand the overall journey and opportunities of intervention (or existing and potential problems/pain points). Therefore, the EV adoption process nicely ties in with the customer lifecycle stages framework from the Marketing world. Therefore, Persona should be able to move through the entire lifecycle of EV adoption.

Persona Goal Setting
I learned about using this model of the Customer lifecycle journey in UX from an online video called “Using persona grids and positioning to change customer behaviours in UX” on the Vaexperience youtube channel.
The Customer Lifecycle Journey diagram enabled me to empathise with user personas and understand where they are in the travel and which pain points were discovered in the research process they may be experiencing. In addition, it directly fed into the user journey and experience maps.
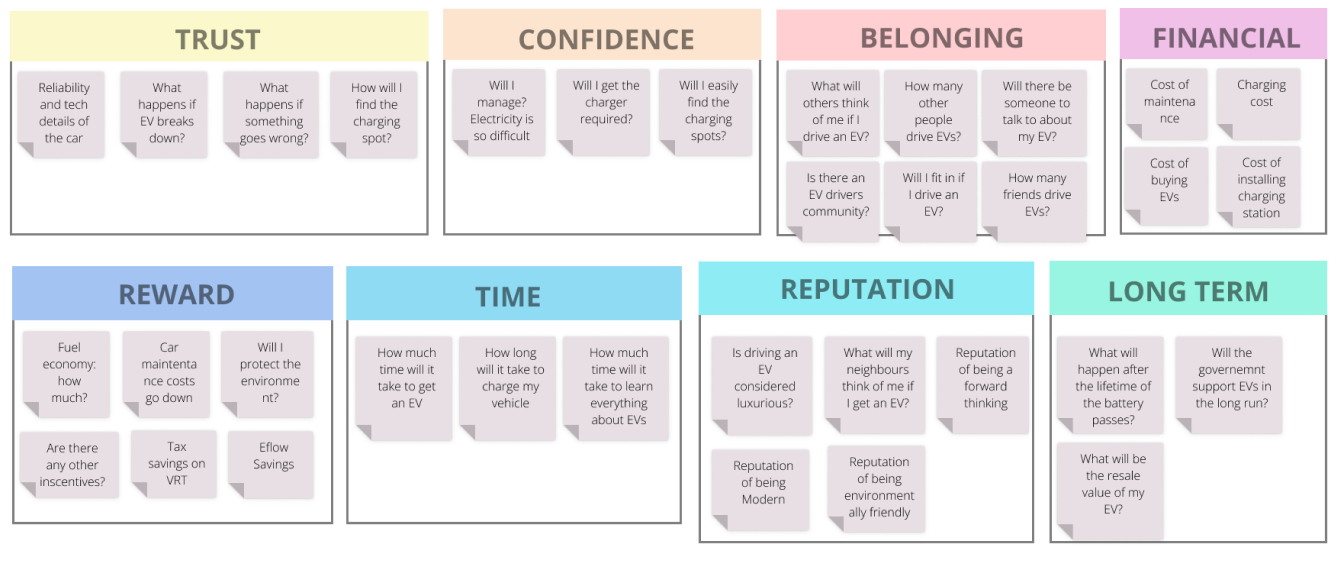
Key Drivers Of Electric Vehicle Adoption
Understanding and mapping out the factors (questions, concerns) affecting users in their journey towards owning EVs is crucial to finding the best possible UX solution for increasing EV adoption. After reviewing the research data (especially the qualitative research), I gathered the drivers influencing EV adoption. I categorised the drivers by eight headings: Trust, Confidence, Belonging, Financial Reward, Time, Reputation and Long term concerns.
These drivers significantly supported mapping the user experience and journey.
User Journey Map “As Is” & “To Be”
I mapped Sarah’s everyday journey from home to work on this page. I depicted two scenarios: “as-is,” i.e. a scenario whereby Sarah is driving her current car.
The second scenario is “to-be,” i.e. I attempted to show how Sarah’s experience would change if she owned the EV.
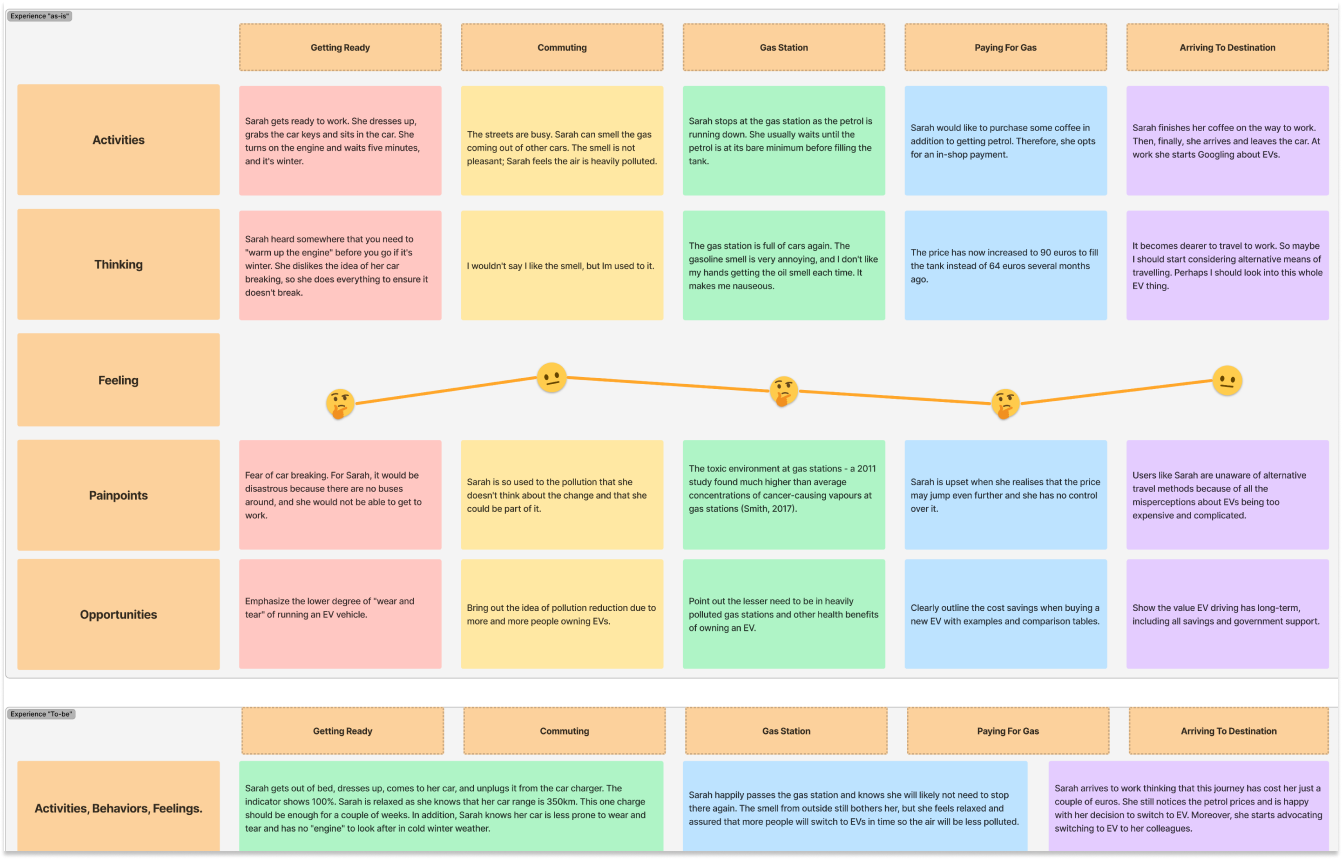
The journey map reveals some possible angles for marketing messaging and UX improvements. In addition, Sarah’s journey map enables us to empathise with Sarah fully, understand her everyday struggles with petrol cars and see the difference in experience that she would feel if she switched to EV.
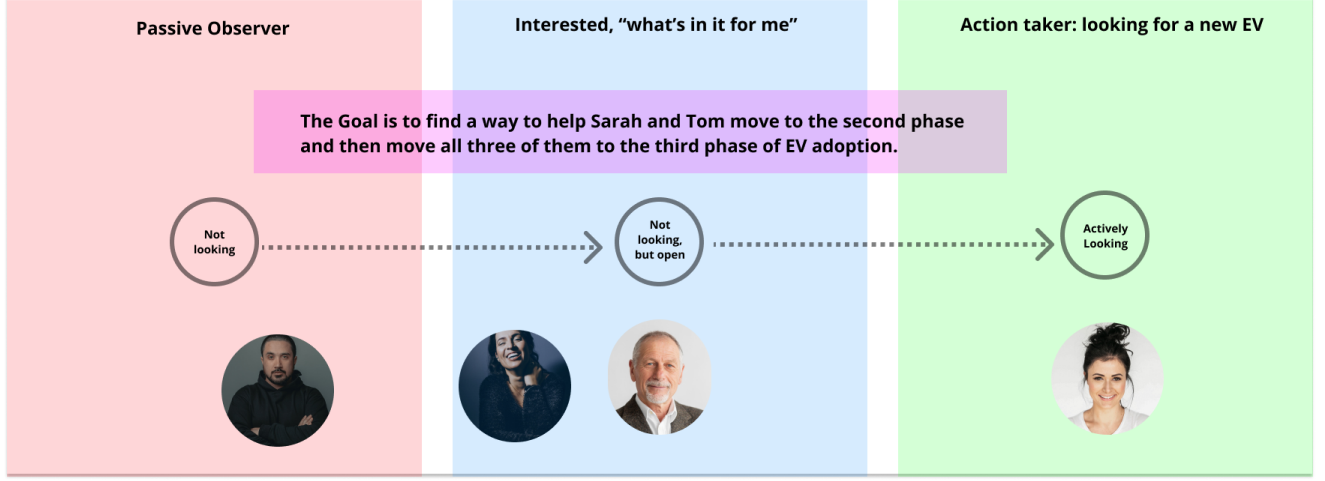
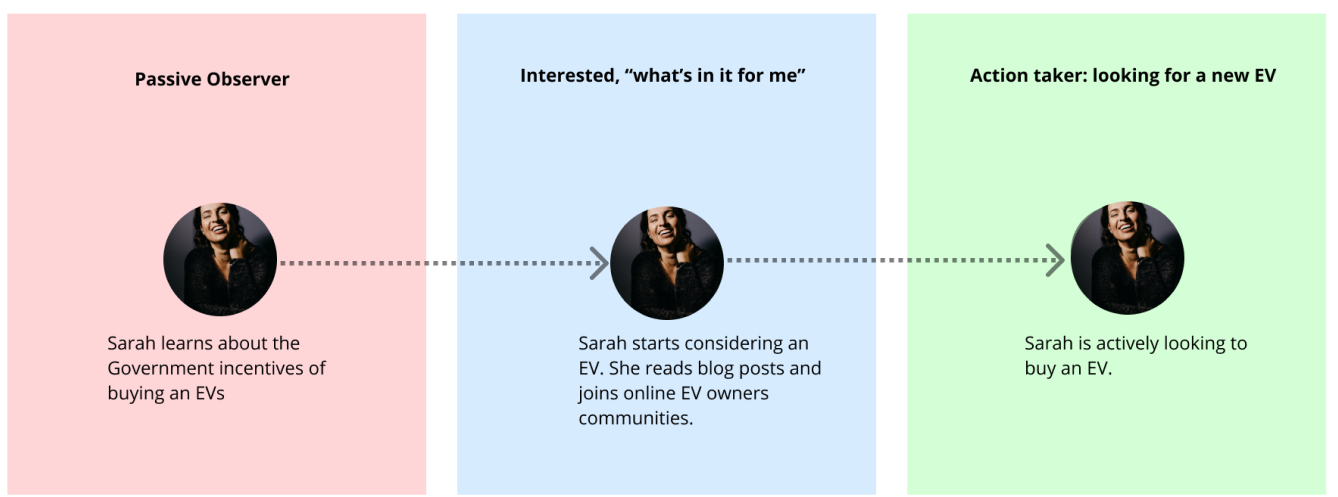
User’s Journey Through Customer Lifecycle Stages
I started redefining Sarah’s experience with a high-level glimpse at the one persona’s (Sarah’s) journey through the customer lifecycle stages. First, Sarah starts her journey as a passive observer; then, she moves into the “interested, what’s in it for me” phase and decides to become an adopter.
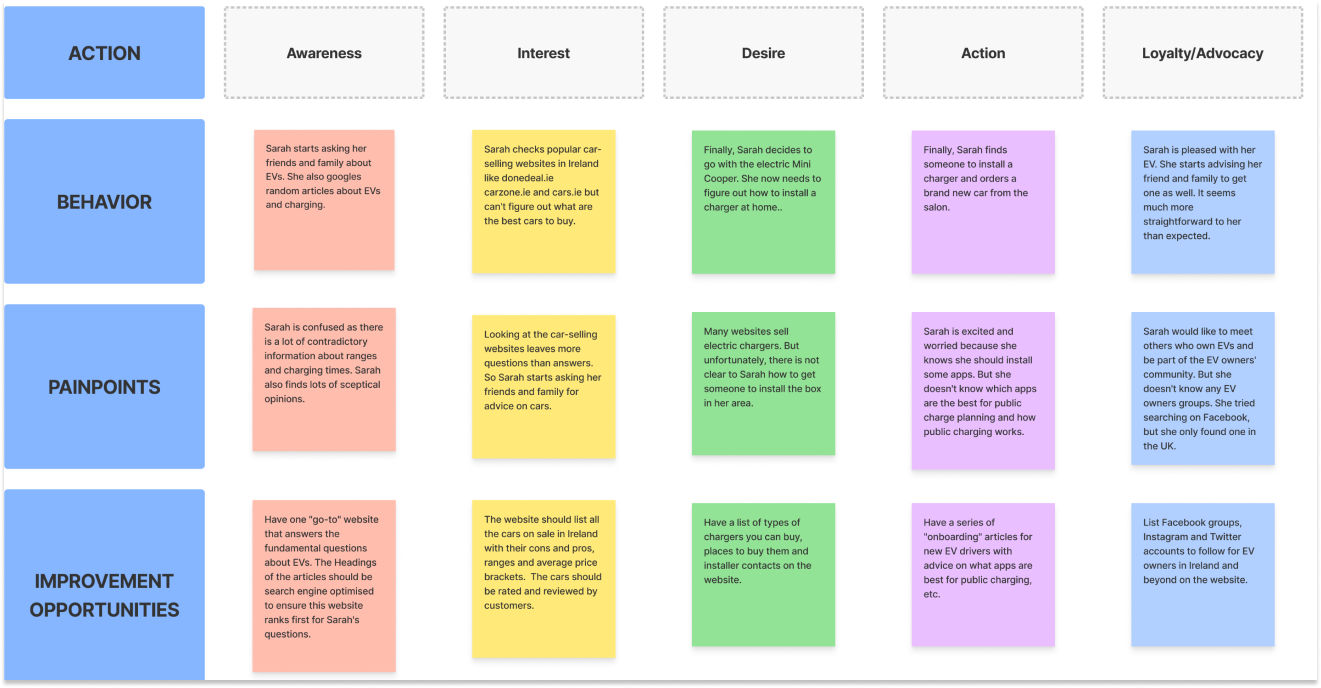
User’s Experience Map
The experience map shows a more detailed journey through the lifecycle stages: awareness, interest, desire, action and loyalty/advocacy. The Experience map helped immensely with the ideation process as I could already uncover some improvement opportunities.
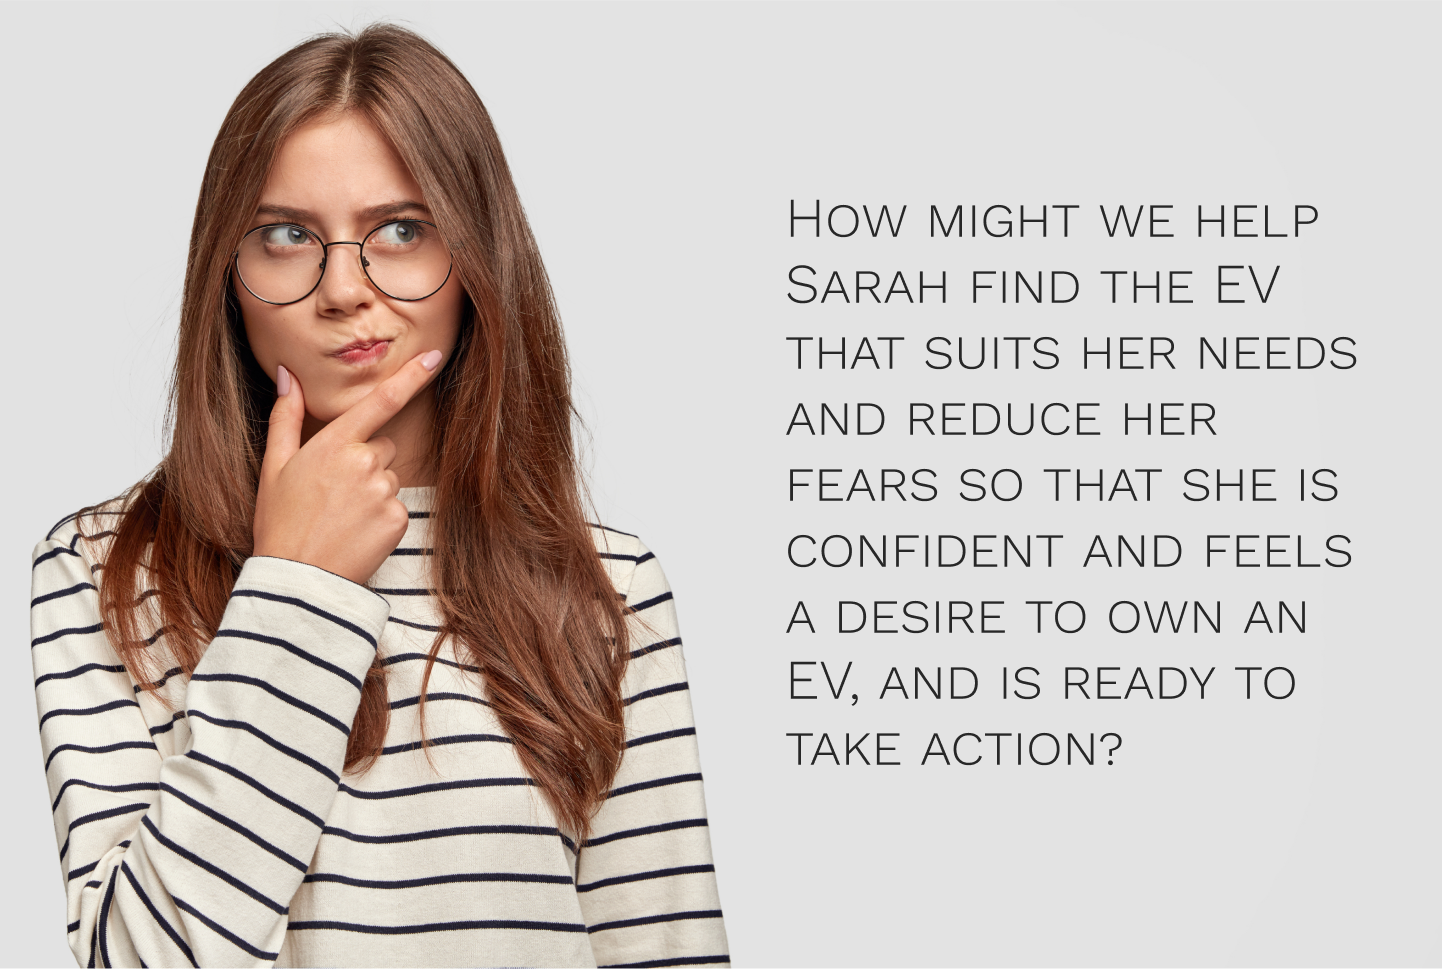
Defining User’s Problem
Sarah is already interested in EVs; however, she has no idea what cars are available, has very little knowledge of how they work and is afraid that EVs would be too complicated for her.
In addition, she hears a lot of negative and contradictive opinions about EVs and struggles to find a good source of information on how to get her EV journey started.
“How Might We” Statement
DEVELOP(IDEATION)
IN THIS SECTION:
1. Rapid Ideation Excercise
2. Competitor Analysis
3. Competitor Benchmarking
4. Solutions Considered
5. Proposed Solution to User’s Problem
6. MVP – Minimal Viable Product
COMING NEXT:
DELIVER(IMPLEMENTATION)
PREVIOUS SECTION: DEFINE (SYNTHESIS)
TO THE BEGINNING
TO THE END
Rapid Ideation Excercise
To ideate and try solving the “how might we” question, I asked one of the stakeholders to assist me. We ran a rapid ideation session.
First, I introduced him to the findings of the study. Then, together we reviewed the basic categories of the affinity diagram.
I wrote the categories on their separate sheets of paper and asked the stakeholder to think and write down all possible solutions that came to their mind that would address each of the categories. In addition, this was a timed workshop set for 20 minutes.
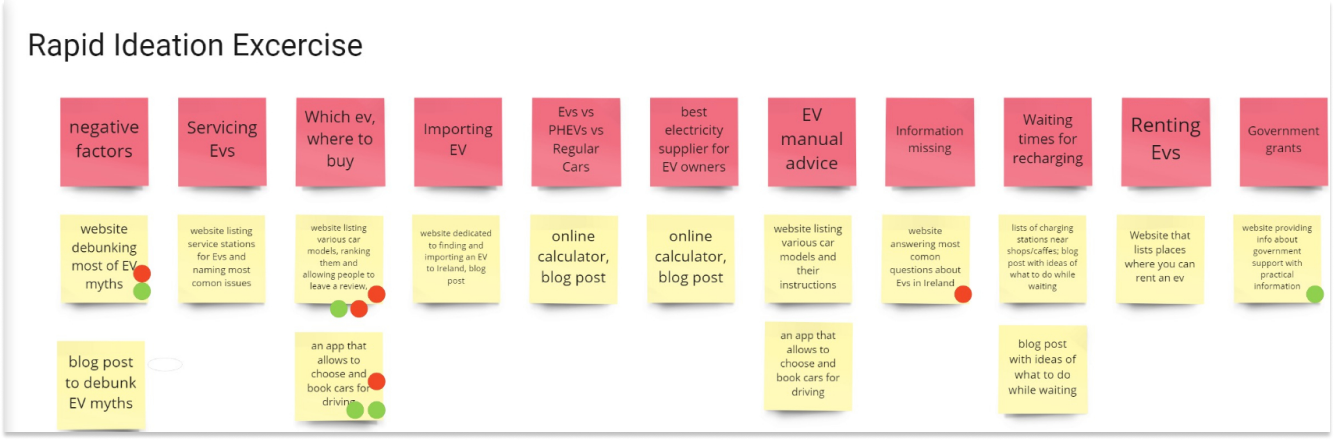
After the session, I recorded our ideas in an Excel sheet and transferred them to Miro boards.
The next step was to vote for the solutions we each favoured most.
We each had five votes. The following were the voting results:
The next step was to check the market and see what solutions were already available, as I wanted to introduce something that was not yet available in Ireland. Therefore, I ran a quick competitor analysis.
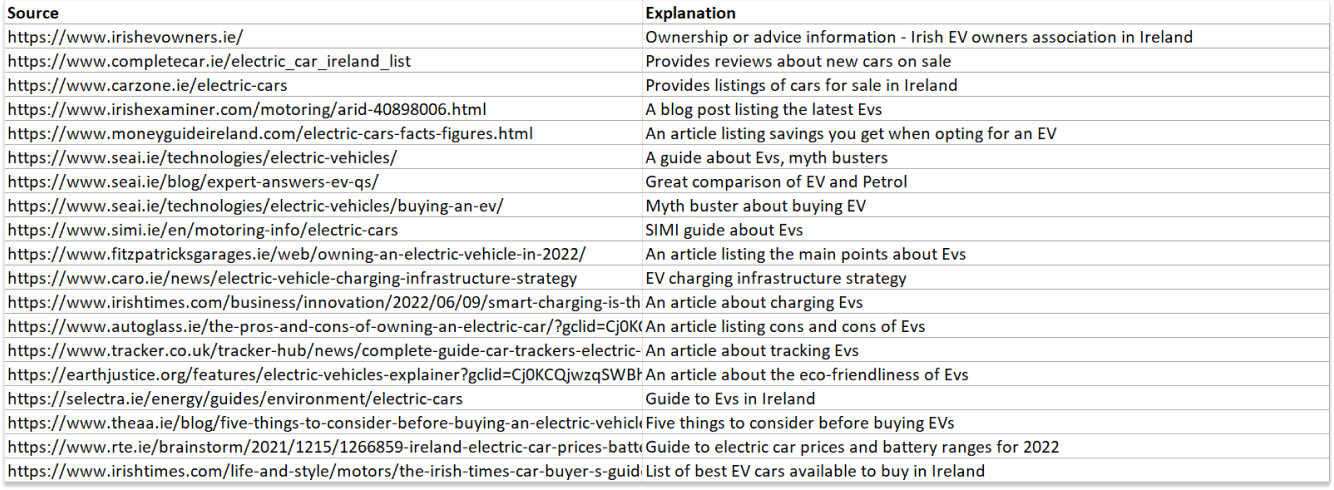
Competitor Analysis
To find the existing competition, I reviewed Google results for the first four pages of the query “Electric Vehicle Guide Ireland” to see what information is available to Irish customers. Interestingly, there are very few websites dedicated to EVs, but most of the search results were EV guides in the form of articles on various news websites.
This data indicates an opportunity for a website or an app solely dedicated to EVs.
Running the Competitor analysis and review allowed me to understand what content is already out there and how this content serves the user’s need to get information about EVs. However, it also led me to believe that the amount of information on each source is inconclusive, and there is a severe need for a convenient source with all EV-related knowledge in one place.
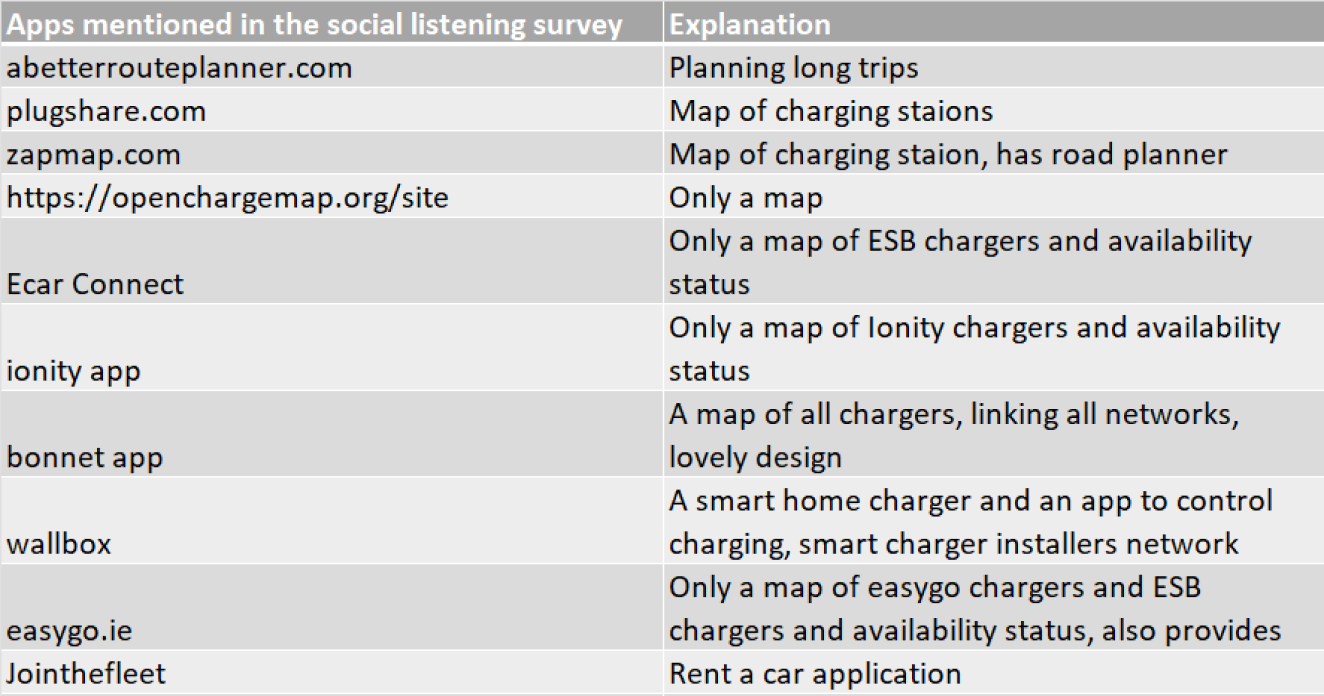
While doing the Social media research, I recorded all mentions of applications on the Irish EV Owners Association Facebook group. Then, in the competition analysis phase, I reviewed all the applications to see if there were any opportunities to improve the existing user experience. Most of the apps were related to long-trip planning, maps of charging stations, and availability. Moreover, most apps have a decent design and functionality; therefore, I concluded that the EV charger market was too saturated, and the solutions are already out there.
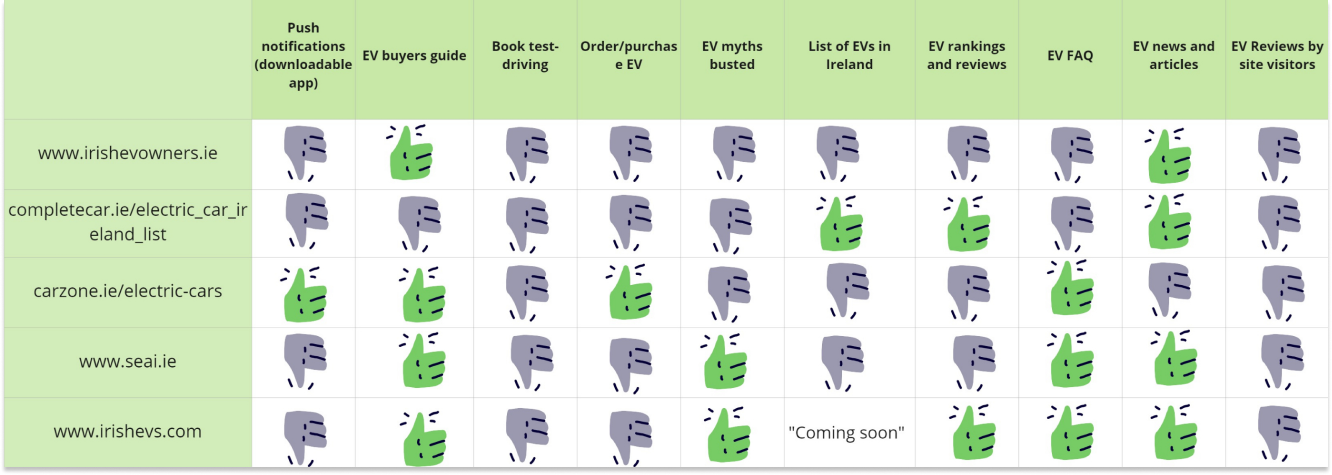
Competitor Benchmarking
Finally, from the Google search results in the competitor table, I selected the first five results that are not media or news outlets. In addition, these websites are either entirely dedicated to EVs or have sections dedicated to EVs. Therefore, I reviewed their functionality and came up with a list of features to compare. Since my ideation process resulted in a test-driving app idea, I also included a test-driving function.
Solutions Considered
It is worth noting that after reviewing competitors, I returned to the list of brainstormed ideas and re-evaluated them in light of already existing solutions. I also considered and explored some additional potential solutions to the user’s problem:
A website debunking most EV myths and answering most common questions about Evs in Ireland – Competitors’ review uncovered many blog and mass media articles about EVs and guides to EV ownership. So the competition is very saturated, and it would be challenging to rank in search results just for the keywords related to “EV guide” Therefore, this idea would likely work better as a feature rather than an actual dedicated solution.
A website listing various car models, ranking them and allowing people to leave a review – I thought it would be a good idea to include it as a feature (or the main feature) rather than a separate website as the completecar.ie already list all EVs available in Ireland.
However, they don’t allow people to leave reviews about EVs.
A website/blog dedicated to finding and importing an EV to Ireland – I thought it would be enough to have this as a blog post or a category of posts rather than the entire website. Youtube channel for potential EV owners answering all questions they have – There are a lot of US, UK and German Youtube channels already (not to forget the Irish EV owners association’s one). Therefore, I think this niche is saturated.
EV sales app listing new and used EVs – carzone.ie and donedeal.ie already have EVs listed on sale. The competition in the EV sales niche is very high. Users already have options.
An “EV Bingo” application/game listing all common EV myths – would be a fun game to develop; however, it is unlikely that potential EV owners would download it. Such an app would be more helpful to existing EV owners who are in the loyalty/advocacy phase.
An app listing charging stations nearby and their availability – again, plenty of options are already out there, and some apps are good and have superb usability. Also, they are more useful for someone who already owns EVs.
Proposed Solution to User’s Problem
The Venn diagram allowed me to visualise how the three objectives would come together and what solutions could come from merging different ideas.
This exercise resulted in six possible solutions at (post-its at the intersection of the circles).
However, only two of the six ideas were at the intersection of all three circles:
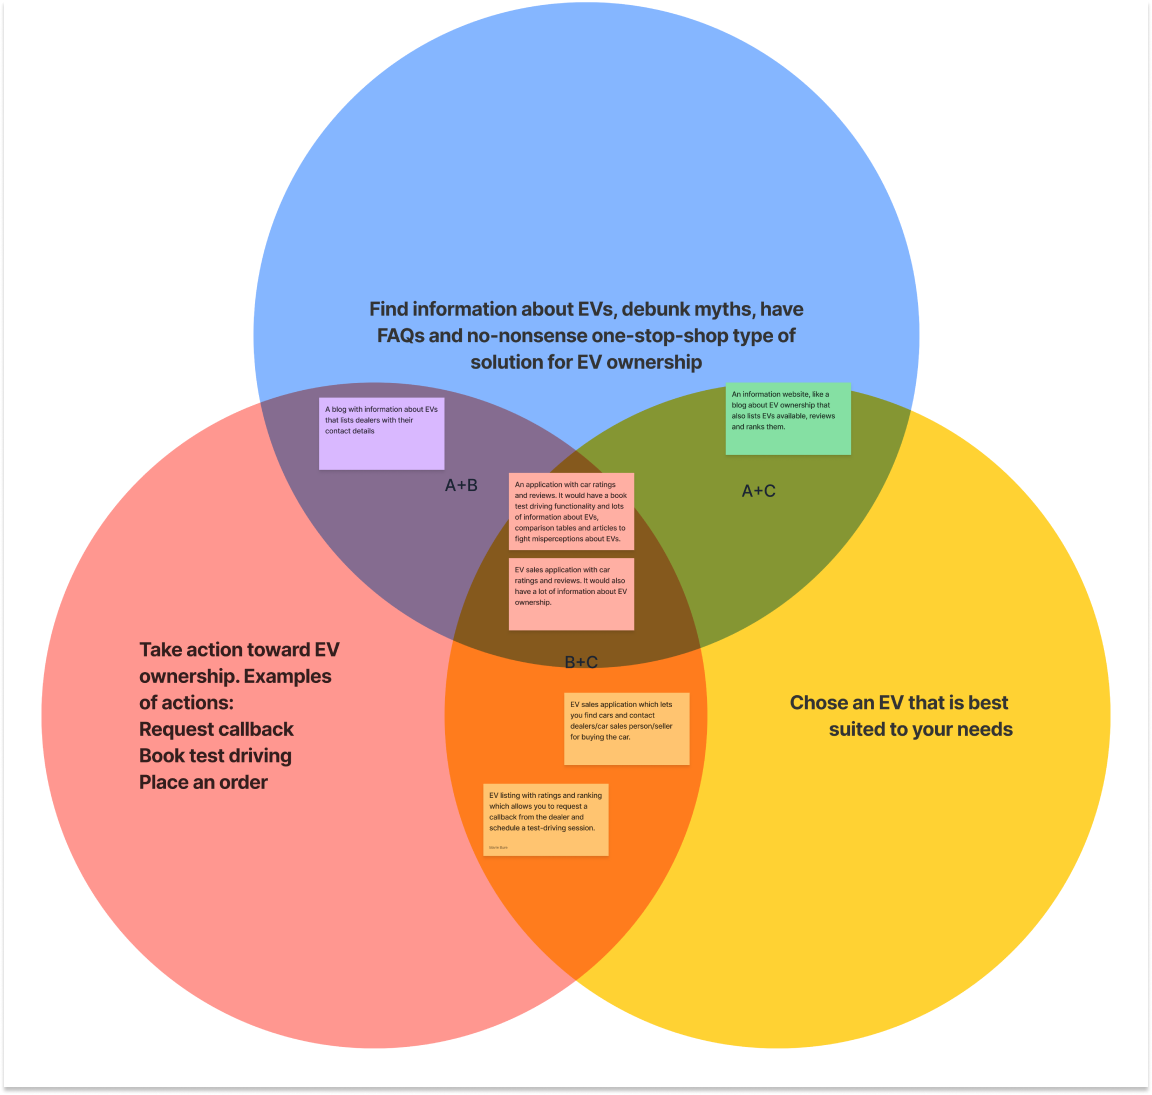
Decision Rationale
I decided to go with the first idea because when conducting competitor analysis, I found that few major car sales websites also list EVs. In contrast, I could not find a single website or an app that allows the booking of EV test driving with various dealers. I chose a mobile rather than a web application mainly because of the push notifications function and the level of personalisation native mobile apps provide.
MVP – Minimal Viable Product
Solution description
So the MVP – Minimal Viable Product, in this case, is an app with FAQ for potential EV owners.
The app should have a listing of new cars, the car rating and review functionality, a function to request a callback from the dealer, a guide to EVs and a set of articles to bust EV myths. I defined the complete list of MVP features in the next chapter.
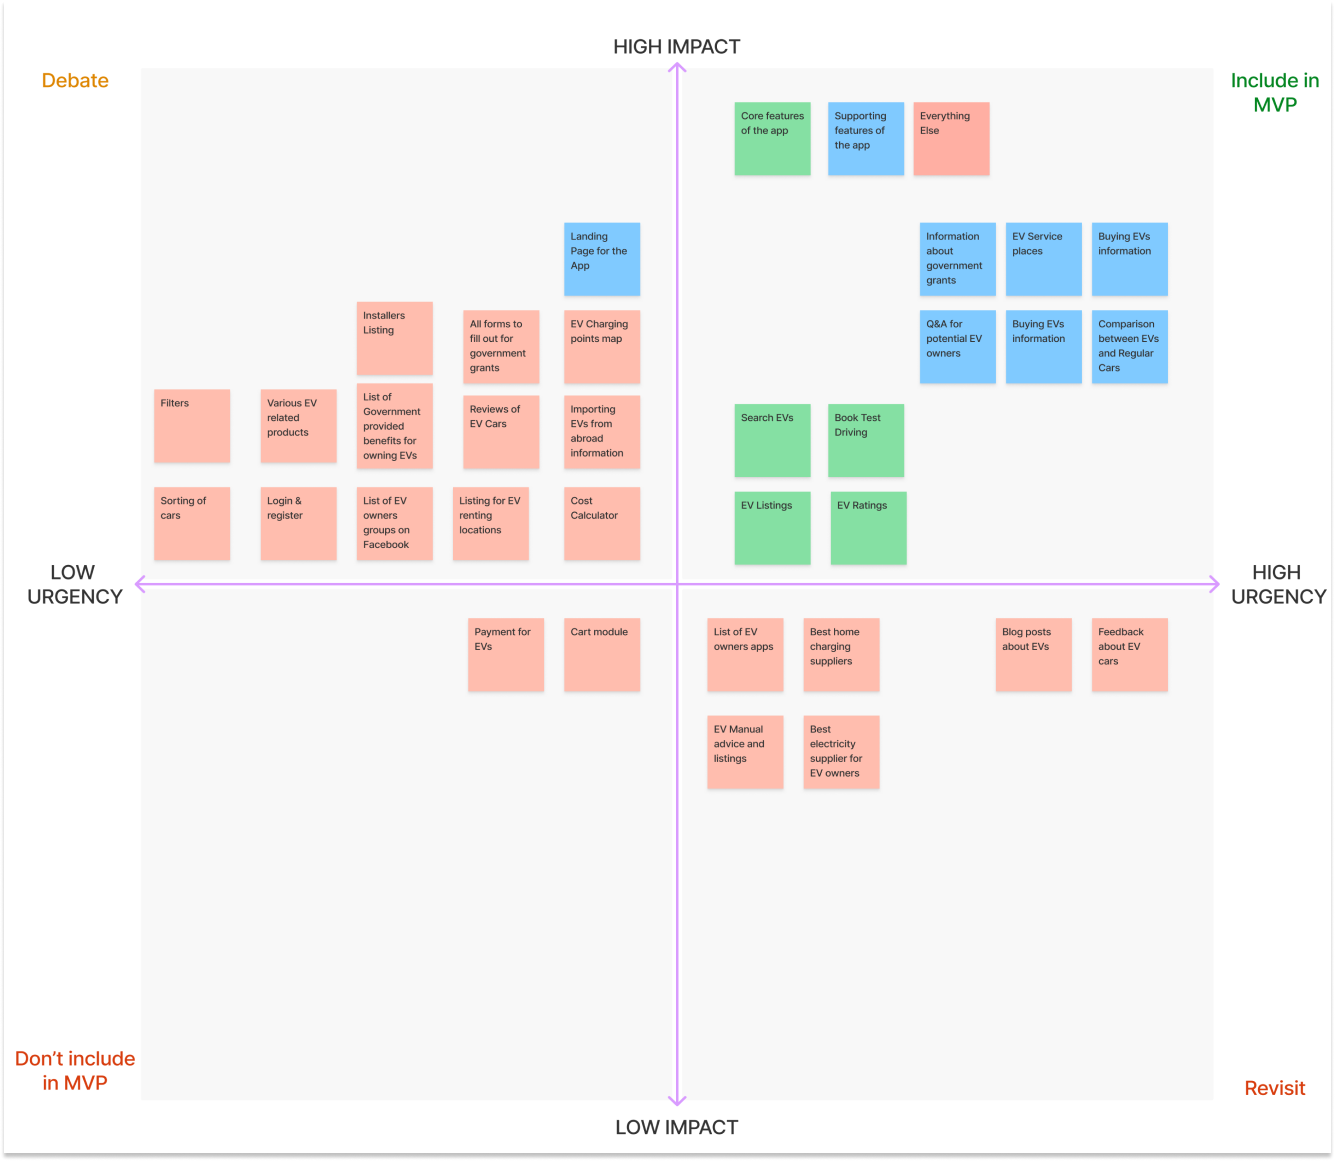
Feature Priority Matrix
A Feature Priority Matrix (Figure 32) is an MVP concept allowing us to decide which features should be built now as part of MVP and which should be planned for future developments. It categorises elements by impact and urgency. Only the features under the “high impact/high urgency” category should be included in MVP.
DELIVER(IMPLEMENTATION)
IN THIS SECTION:
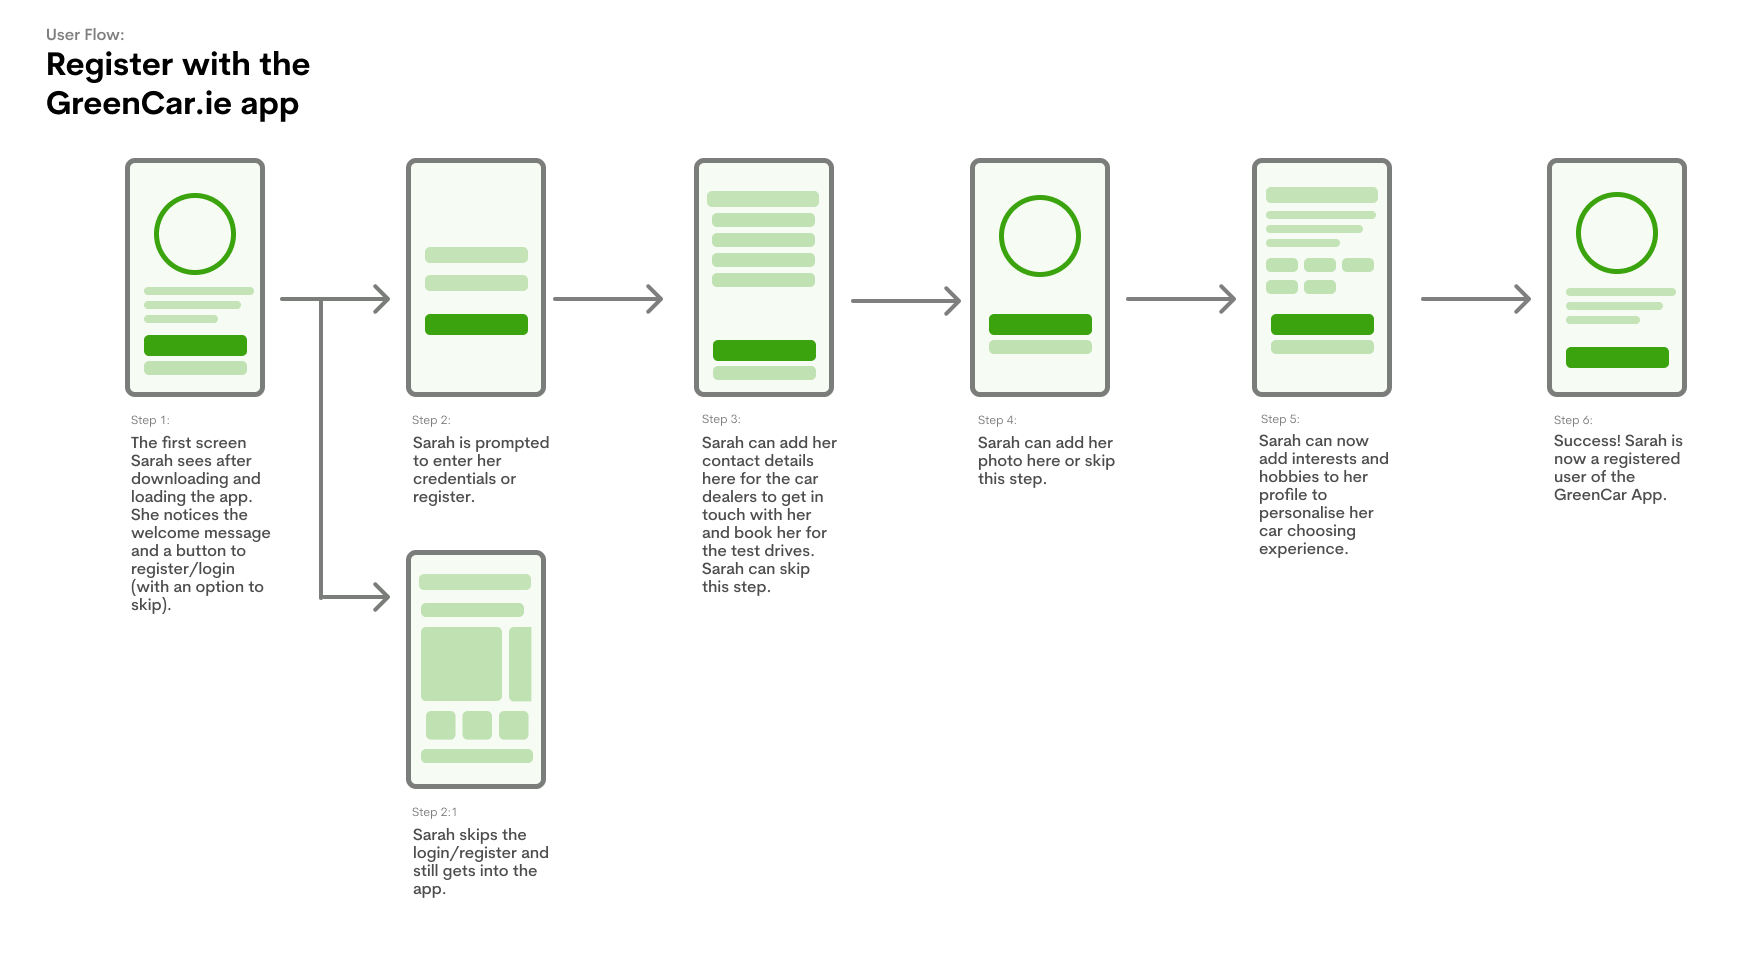
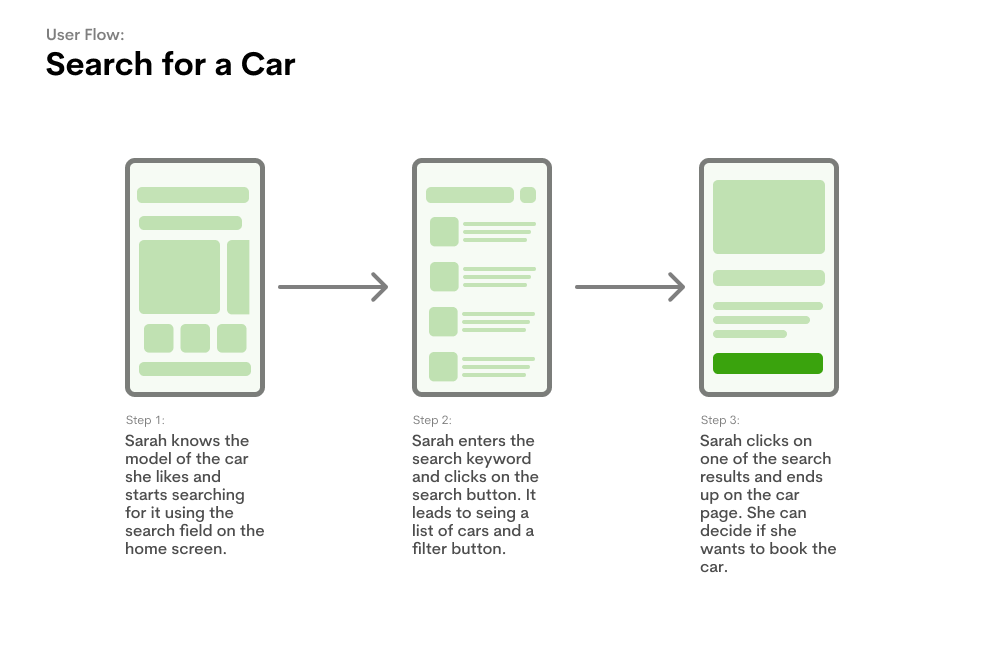
1. User Flows Of The Green Car App
2. Information Architecture
3. Medium Fidelity Prototype
4. Medium Fidelity Prototype Testing
5. High-Fidelity Wireframes & Prototype
6. Prototype Usability Testing
7. Final Solution & Video Walkthrough
8. Conclusion & Key Takeaways
PREVIOUS SECTION: DEVELOP (IDEATION)
TO THE BEGINNING
TO THE END
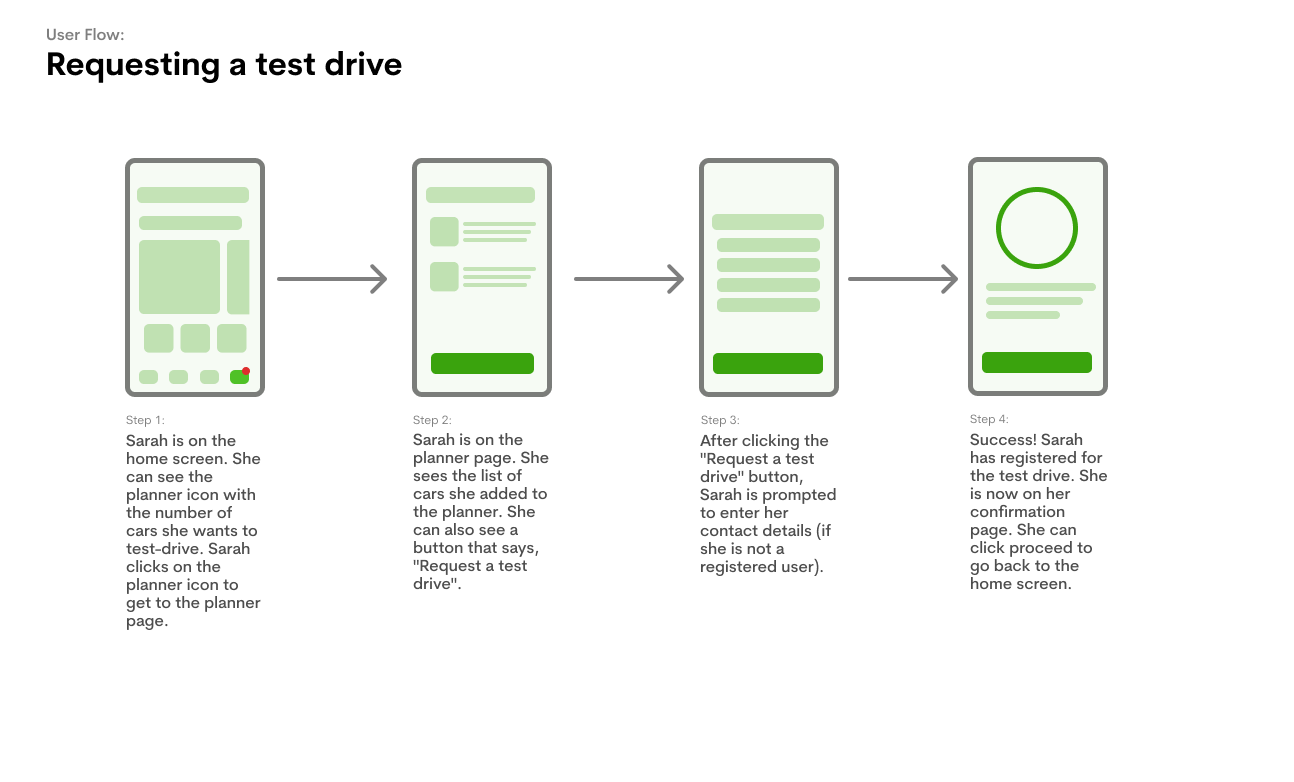
User Flows Of The Green Car App
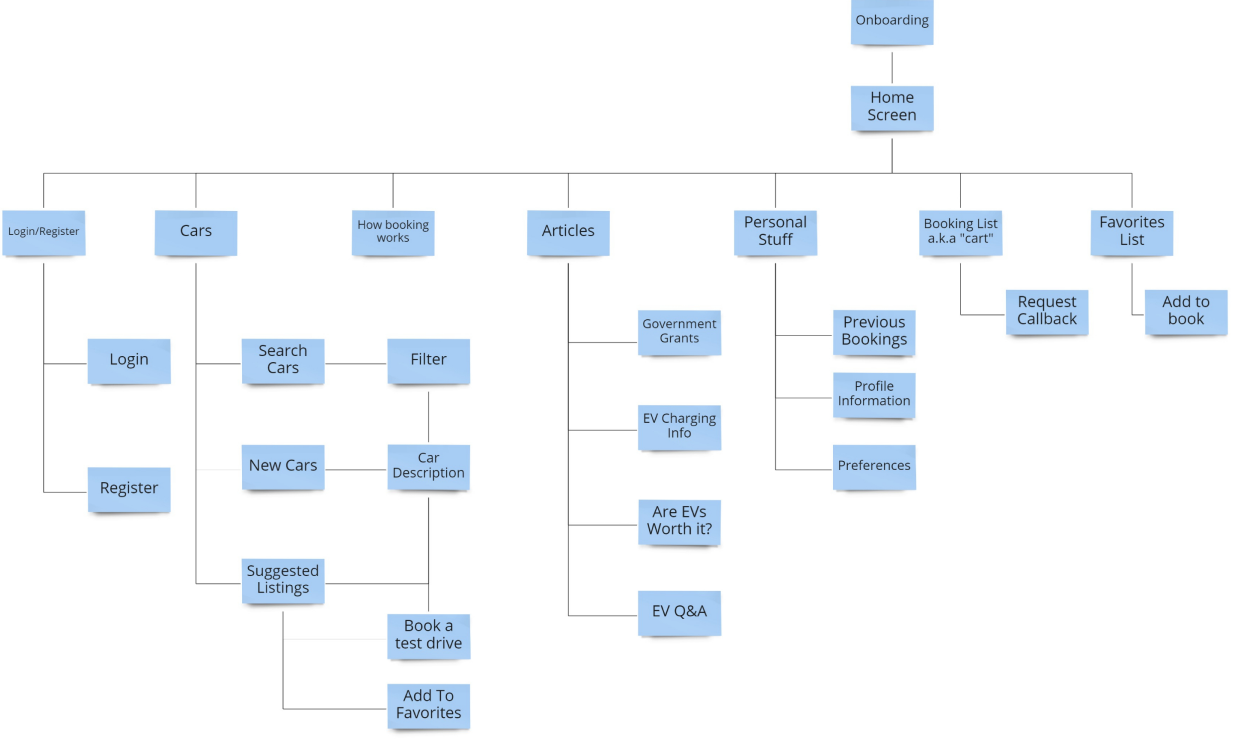
Information Architecture
Medium Fidelity Prototype
After finishing the Information Architecture part, I started developing medium-fidelity wireframes. For the medium fidelity part, I created 20 pages and did prototyping – implemented full interactivity to facilitate user testing.
Medium Fidelity Prototype Testing
Testing process and questions
For the medium fidelity user testing, I chose five people who would all fit into potential EV buyers’ profiles.
User selection criteria for testing
All five users live in their own houses and have one or two cars in the household. In addition, all five would be in the medium to higher income per household range (50k-100k), and all have at least a higher diploma. I sourced them through my friends and acquaintances who had completed the initial survey. I didn’t record the testing sessions but took detailed notes of every step taken.
I expected to see the following:
Hypotheses for testing
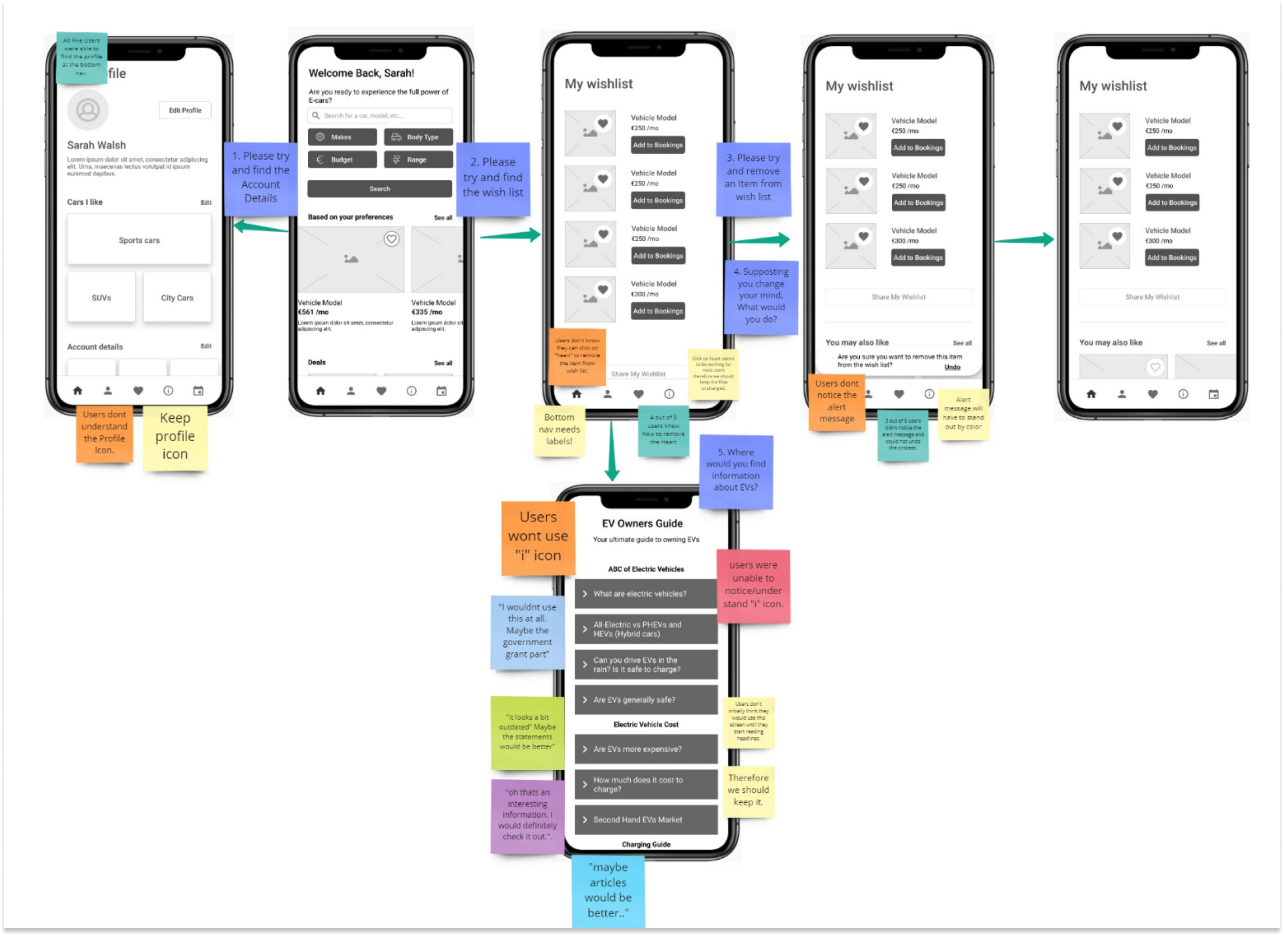
I tested several hypotheses along the way and proved some right and some of them wrong. For example, I assumed that users wouldn’t use and need the four browsing buttons on the home screen. Instead, I learned I was wrong because all users but one clicked on the “make” button. Meanwhile, the hypothesis that users won’t recognize the icons at the bottom of the page turned out to be correct. The testing strongly indicated that I need to rethink the bottom menu and add labels to it.
I transferred testing results and user pain points to the Miro board and recorded them as a flow with post-it notes. Every note colour represents a different user (e.g. “light blue” is user No. 2) as well as my observations. Below I listed the main problem areas to tackle when creating a high-fidelity prototype.
Things to fix when creating high-fidelity wireframes
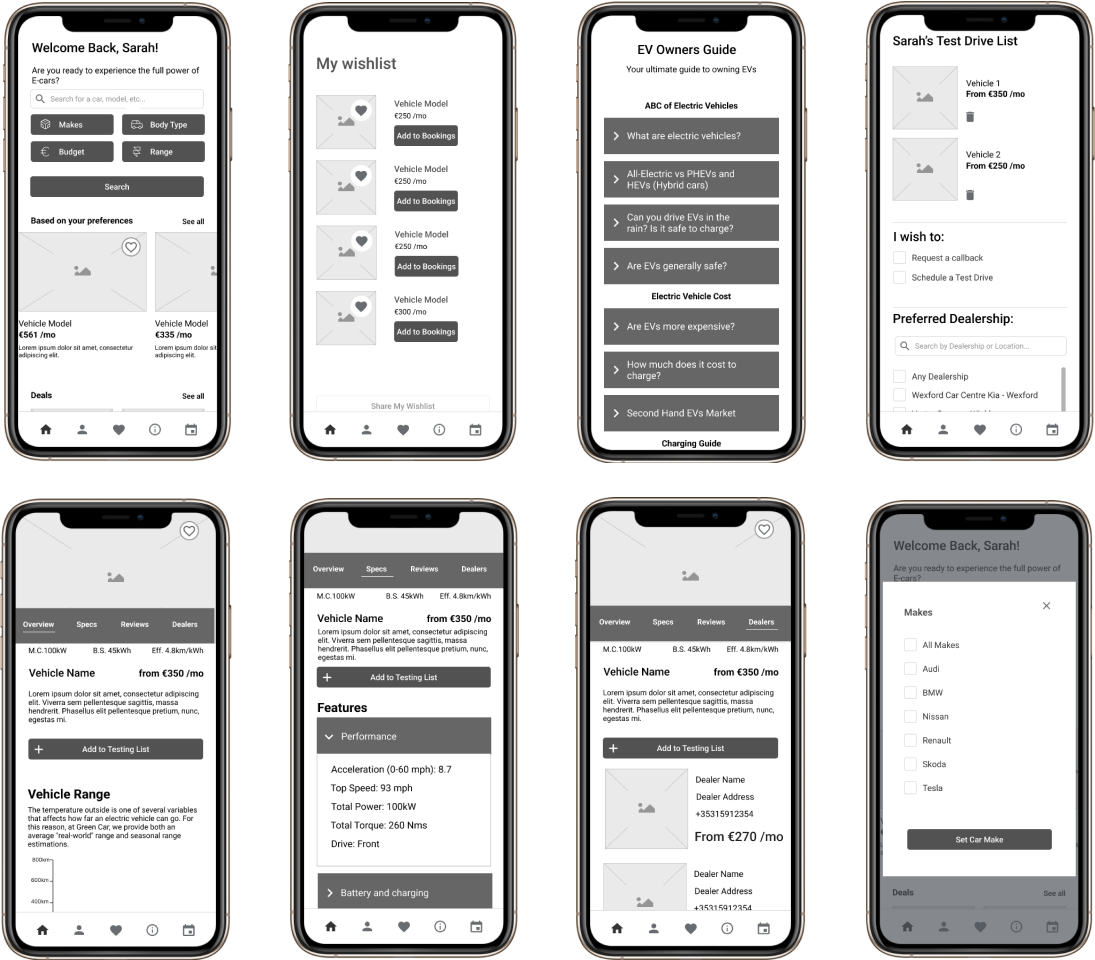
High-Fidelity Wireframes & Prototype
(Before Usability Testing)
Due to the usability issues mentioned in previous pages, I decided to redesign the home screen and the bottom navigation. Therefore, I moved one of the search functions to the bottom menu and on the home screen leaving only two options for the users to choose from: Search by car make and search by model. In addition, I researched and found better icons to represent the menu options. Following this logic, I designed the rest of the pages from the predefined flows and navigation, including EV FAQs, Myth Busting page and EV and Regular car cost comparison table (to debunk some myths around EVs).
Prototype Usability Testing
For the usability test, I used the usertesting.com website. It allows defining the user by nationality, interests, occupation and many other factors. They also allow using user screening questions and post-test questionnaires.
I aimed for five users to test, and since my allowance on usertesting.com was three users, I found two more individuals to test the prototype. All five users tested the app using their mobile phones.
Participant selection and screening
For the usability test, I selected five people who fit the early adopter portrait discovered in the literature review:
30-65-year-old individuals with higher education
Employed part-time, full-time, or self-employed with a salary of €60k and upwards
Interest in technologies (indicated advanced web expertise).
Testing Process
The test consists of three user – flows for the participants to go through. After each of the flows, I asked participants to specify if there was anything they found challenging to find or achieve.
High-Fidelity Prototype Testing Results
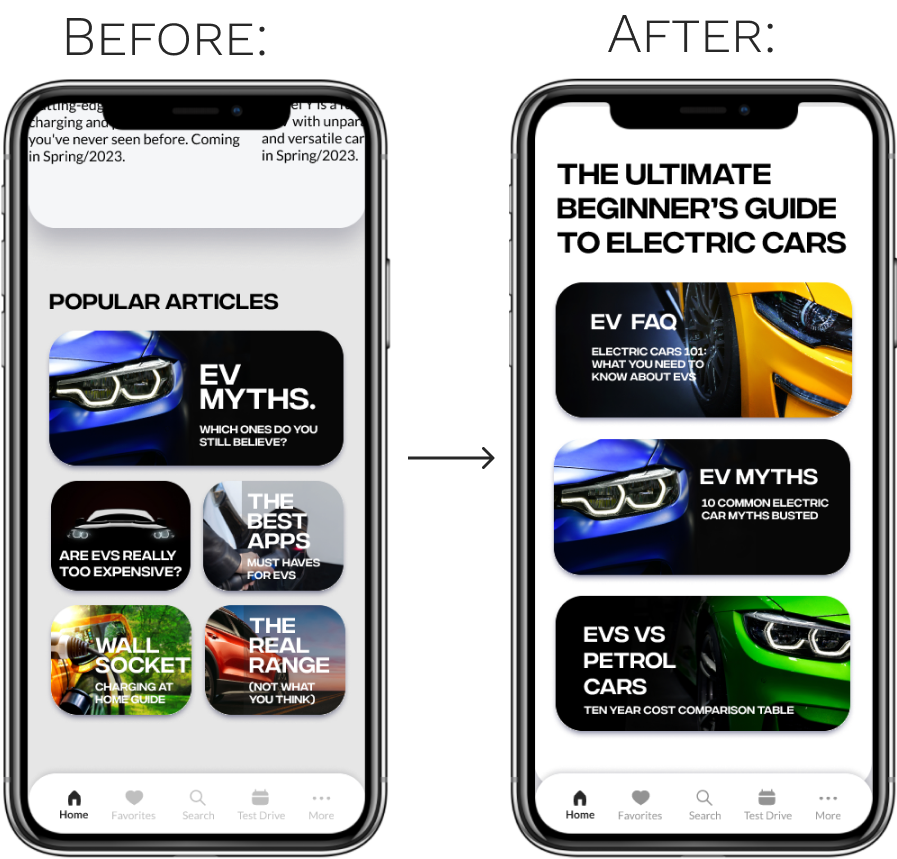
Homescreen Iterations
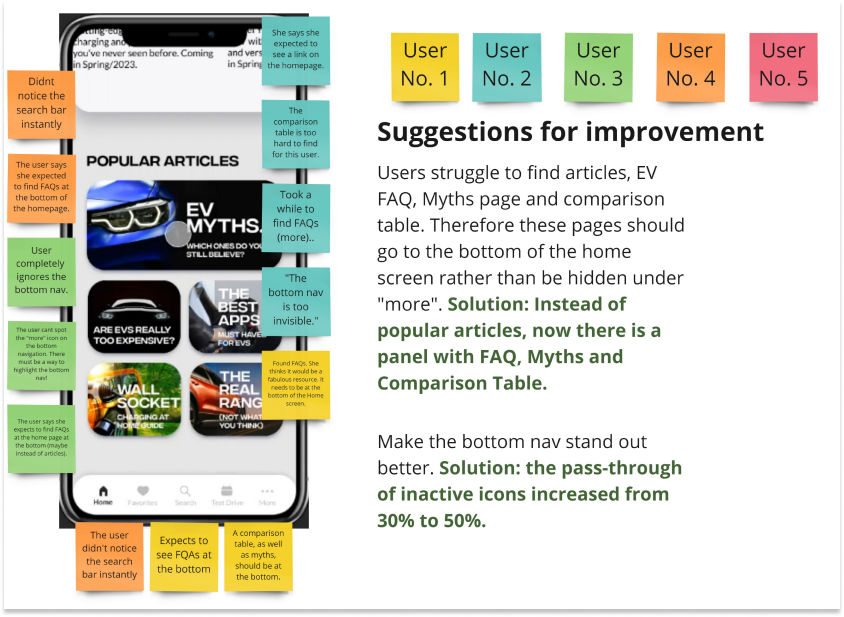
I watched four test recordings (I conducted the fifth test live online and took observational notes while watching the participant go through the user flows). In the same way, as in the wireframes testing, I captured the screens users were going through and recorded observations on sticky notes on Miro.
Changes implemented:
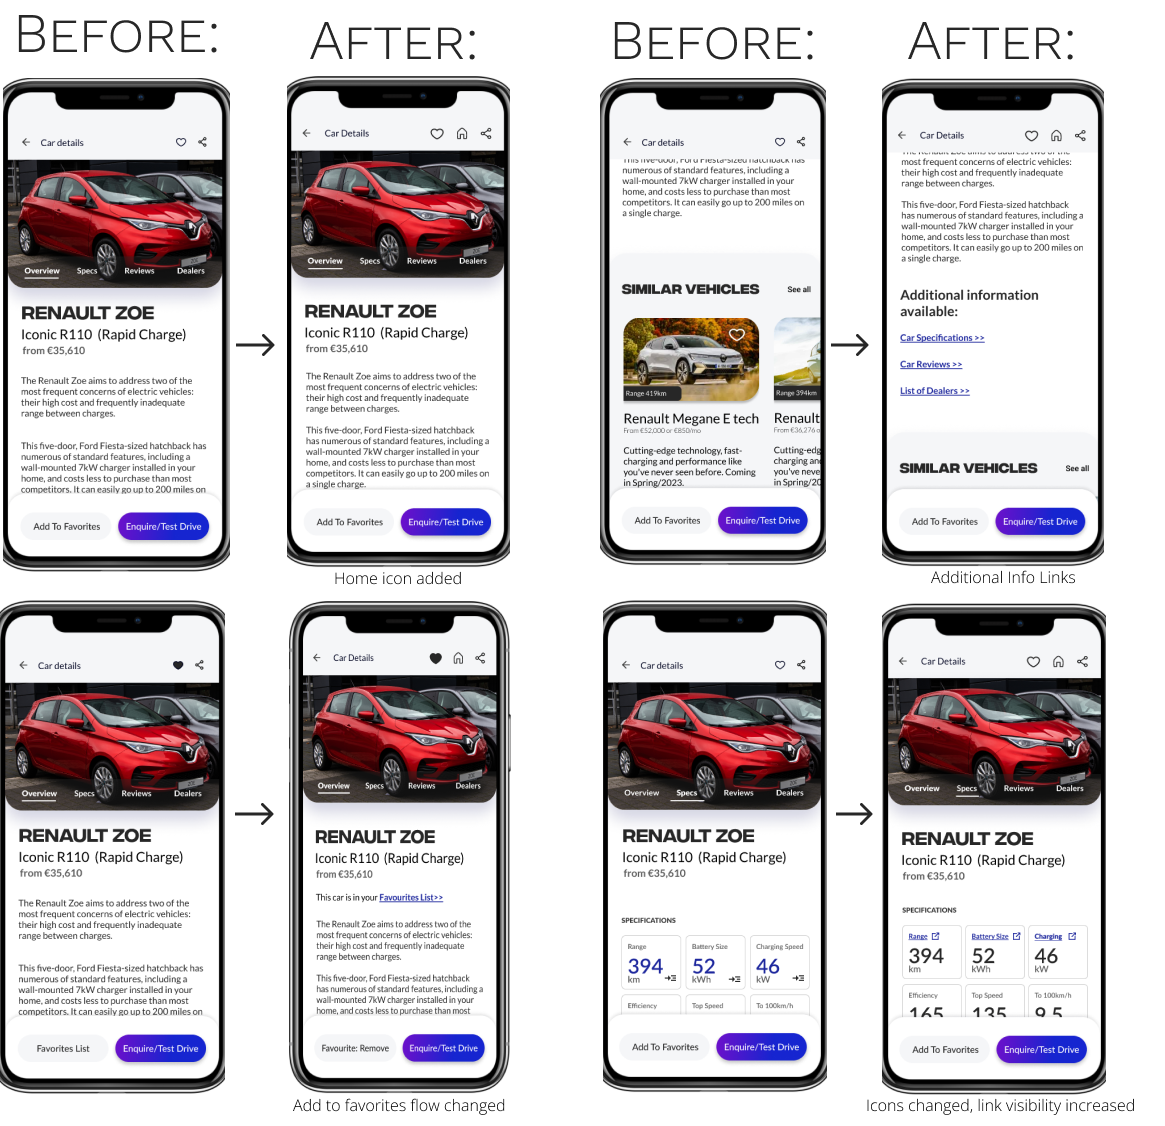
Car Details Screen Iterations
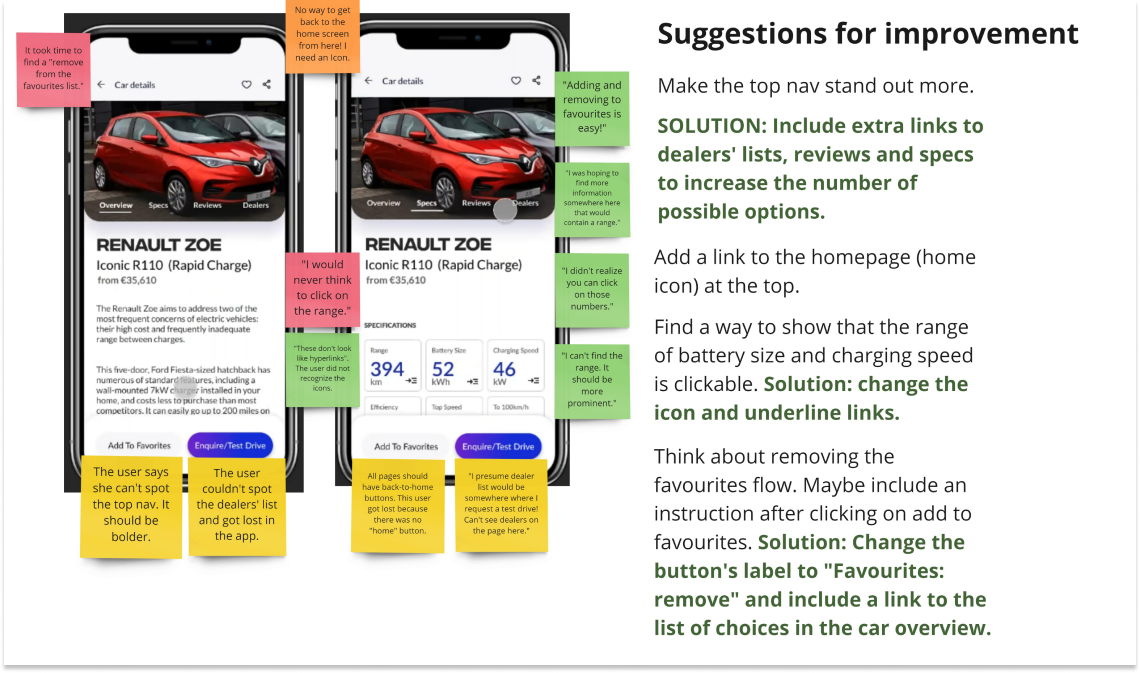
Changes implemented:
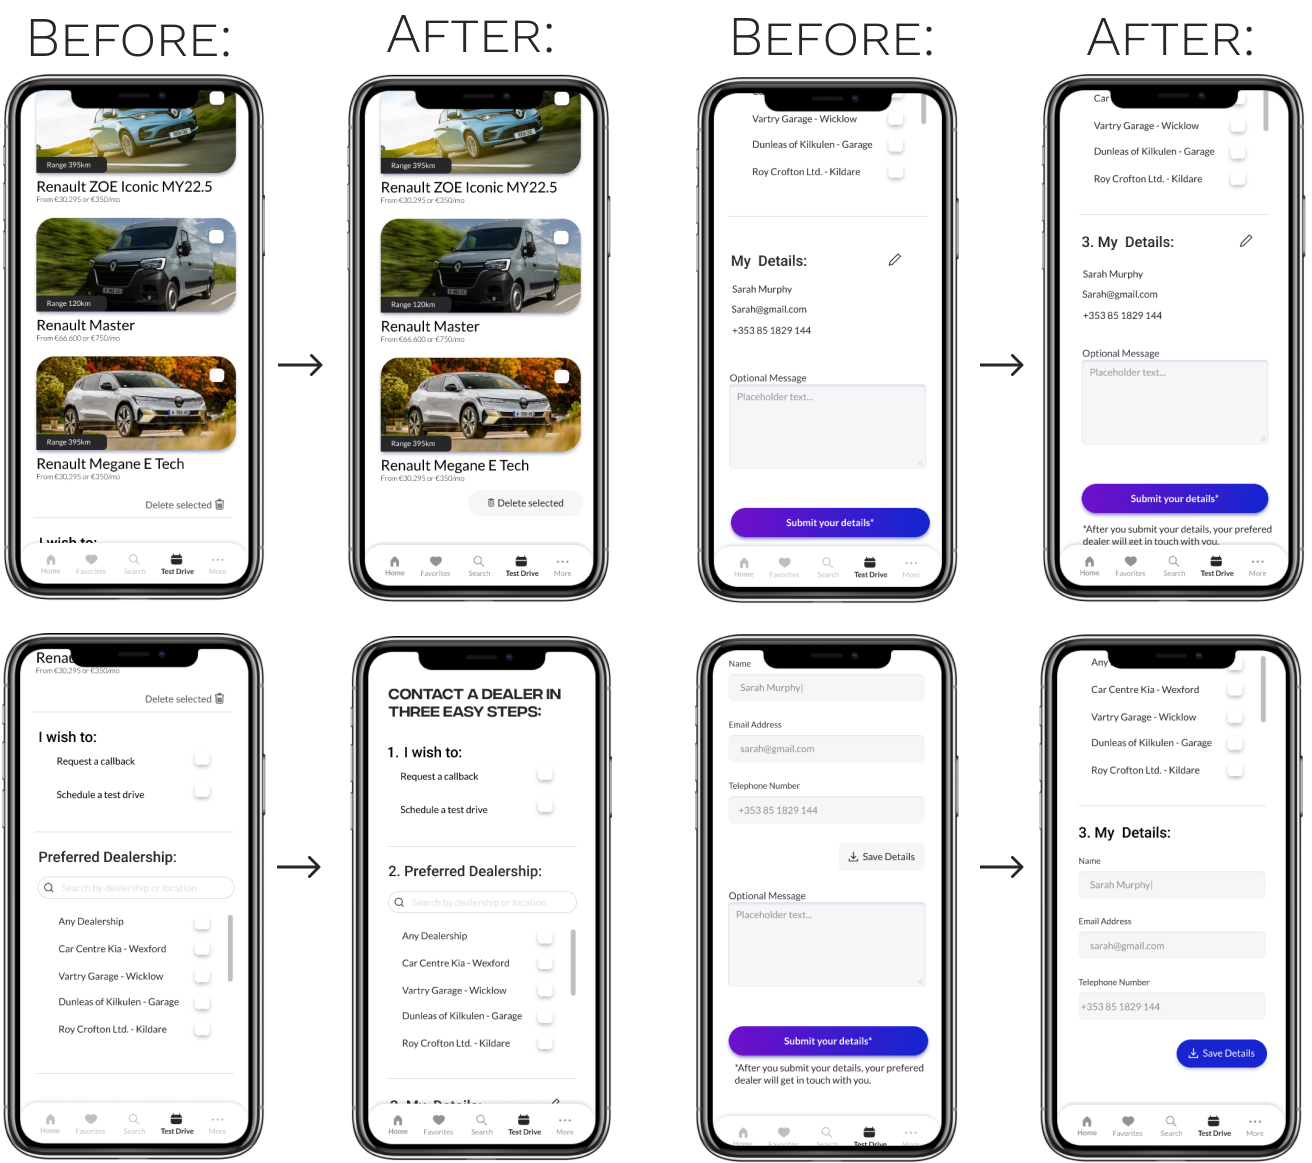
Test Driving List Iterations
Changes implemented:
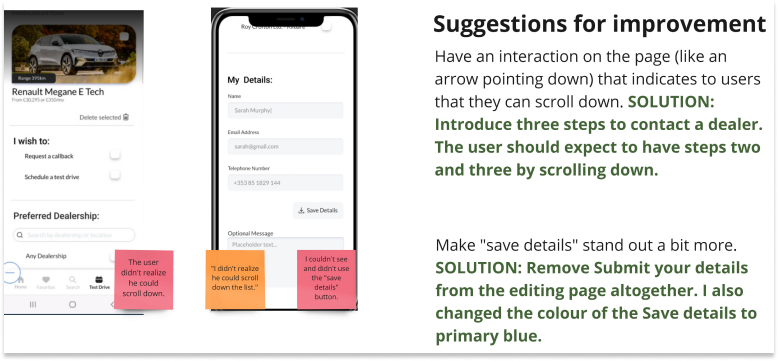
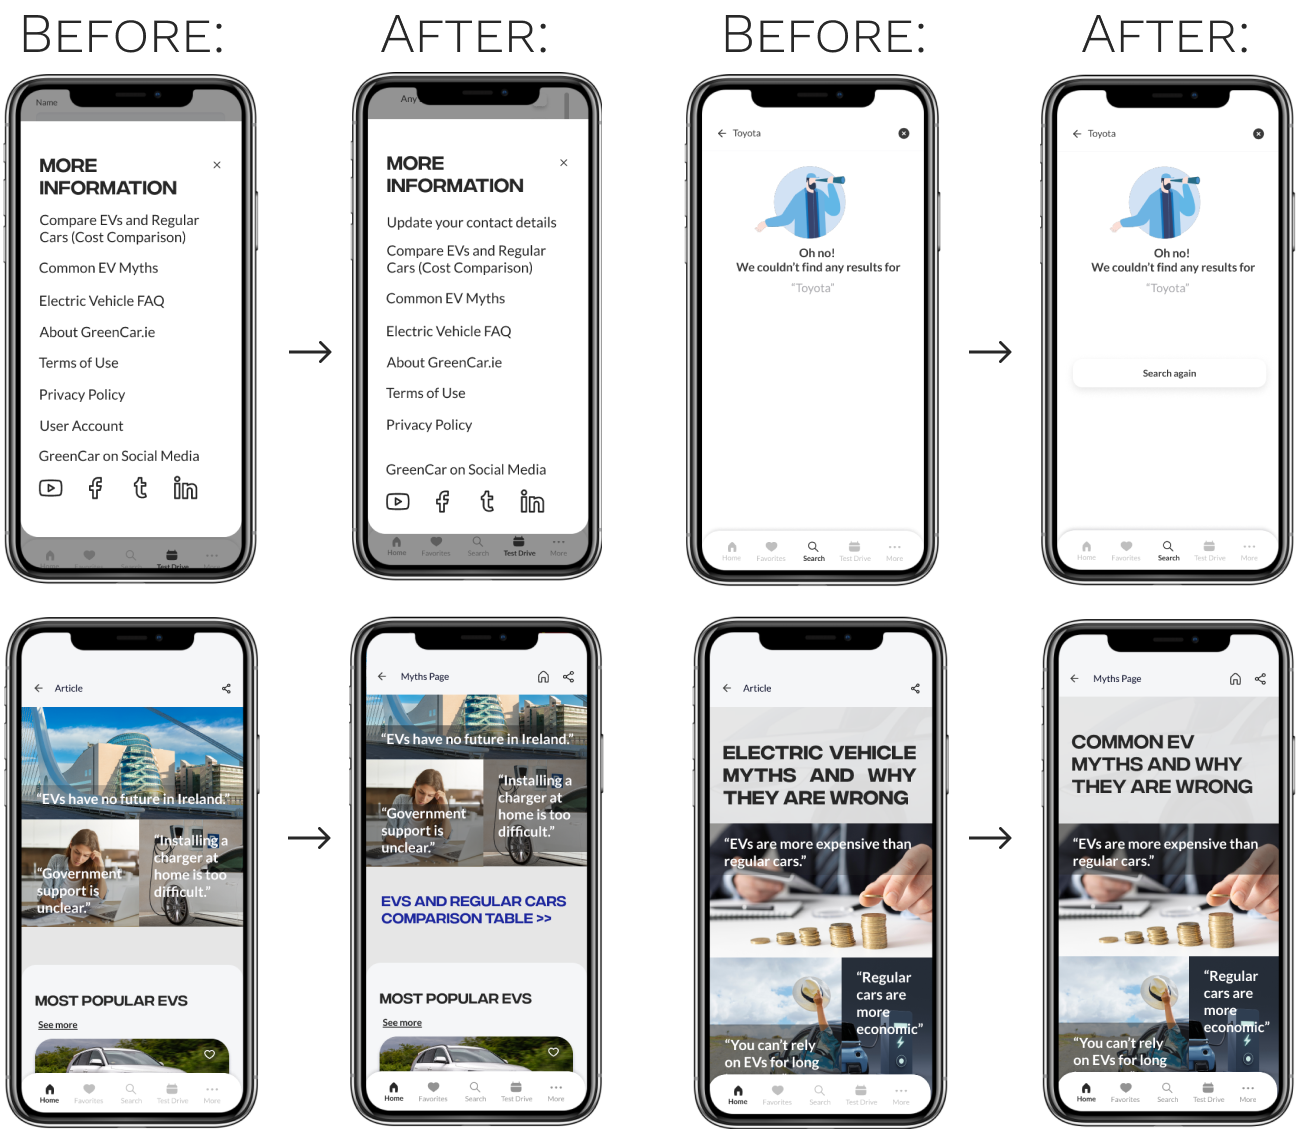
Some Additional Improvements
Changes implemented:
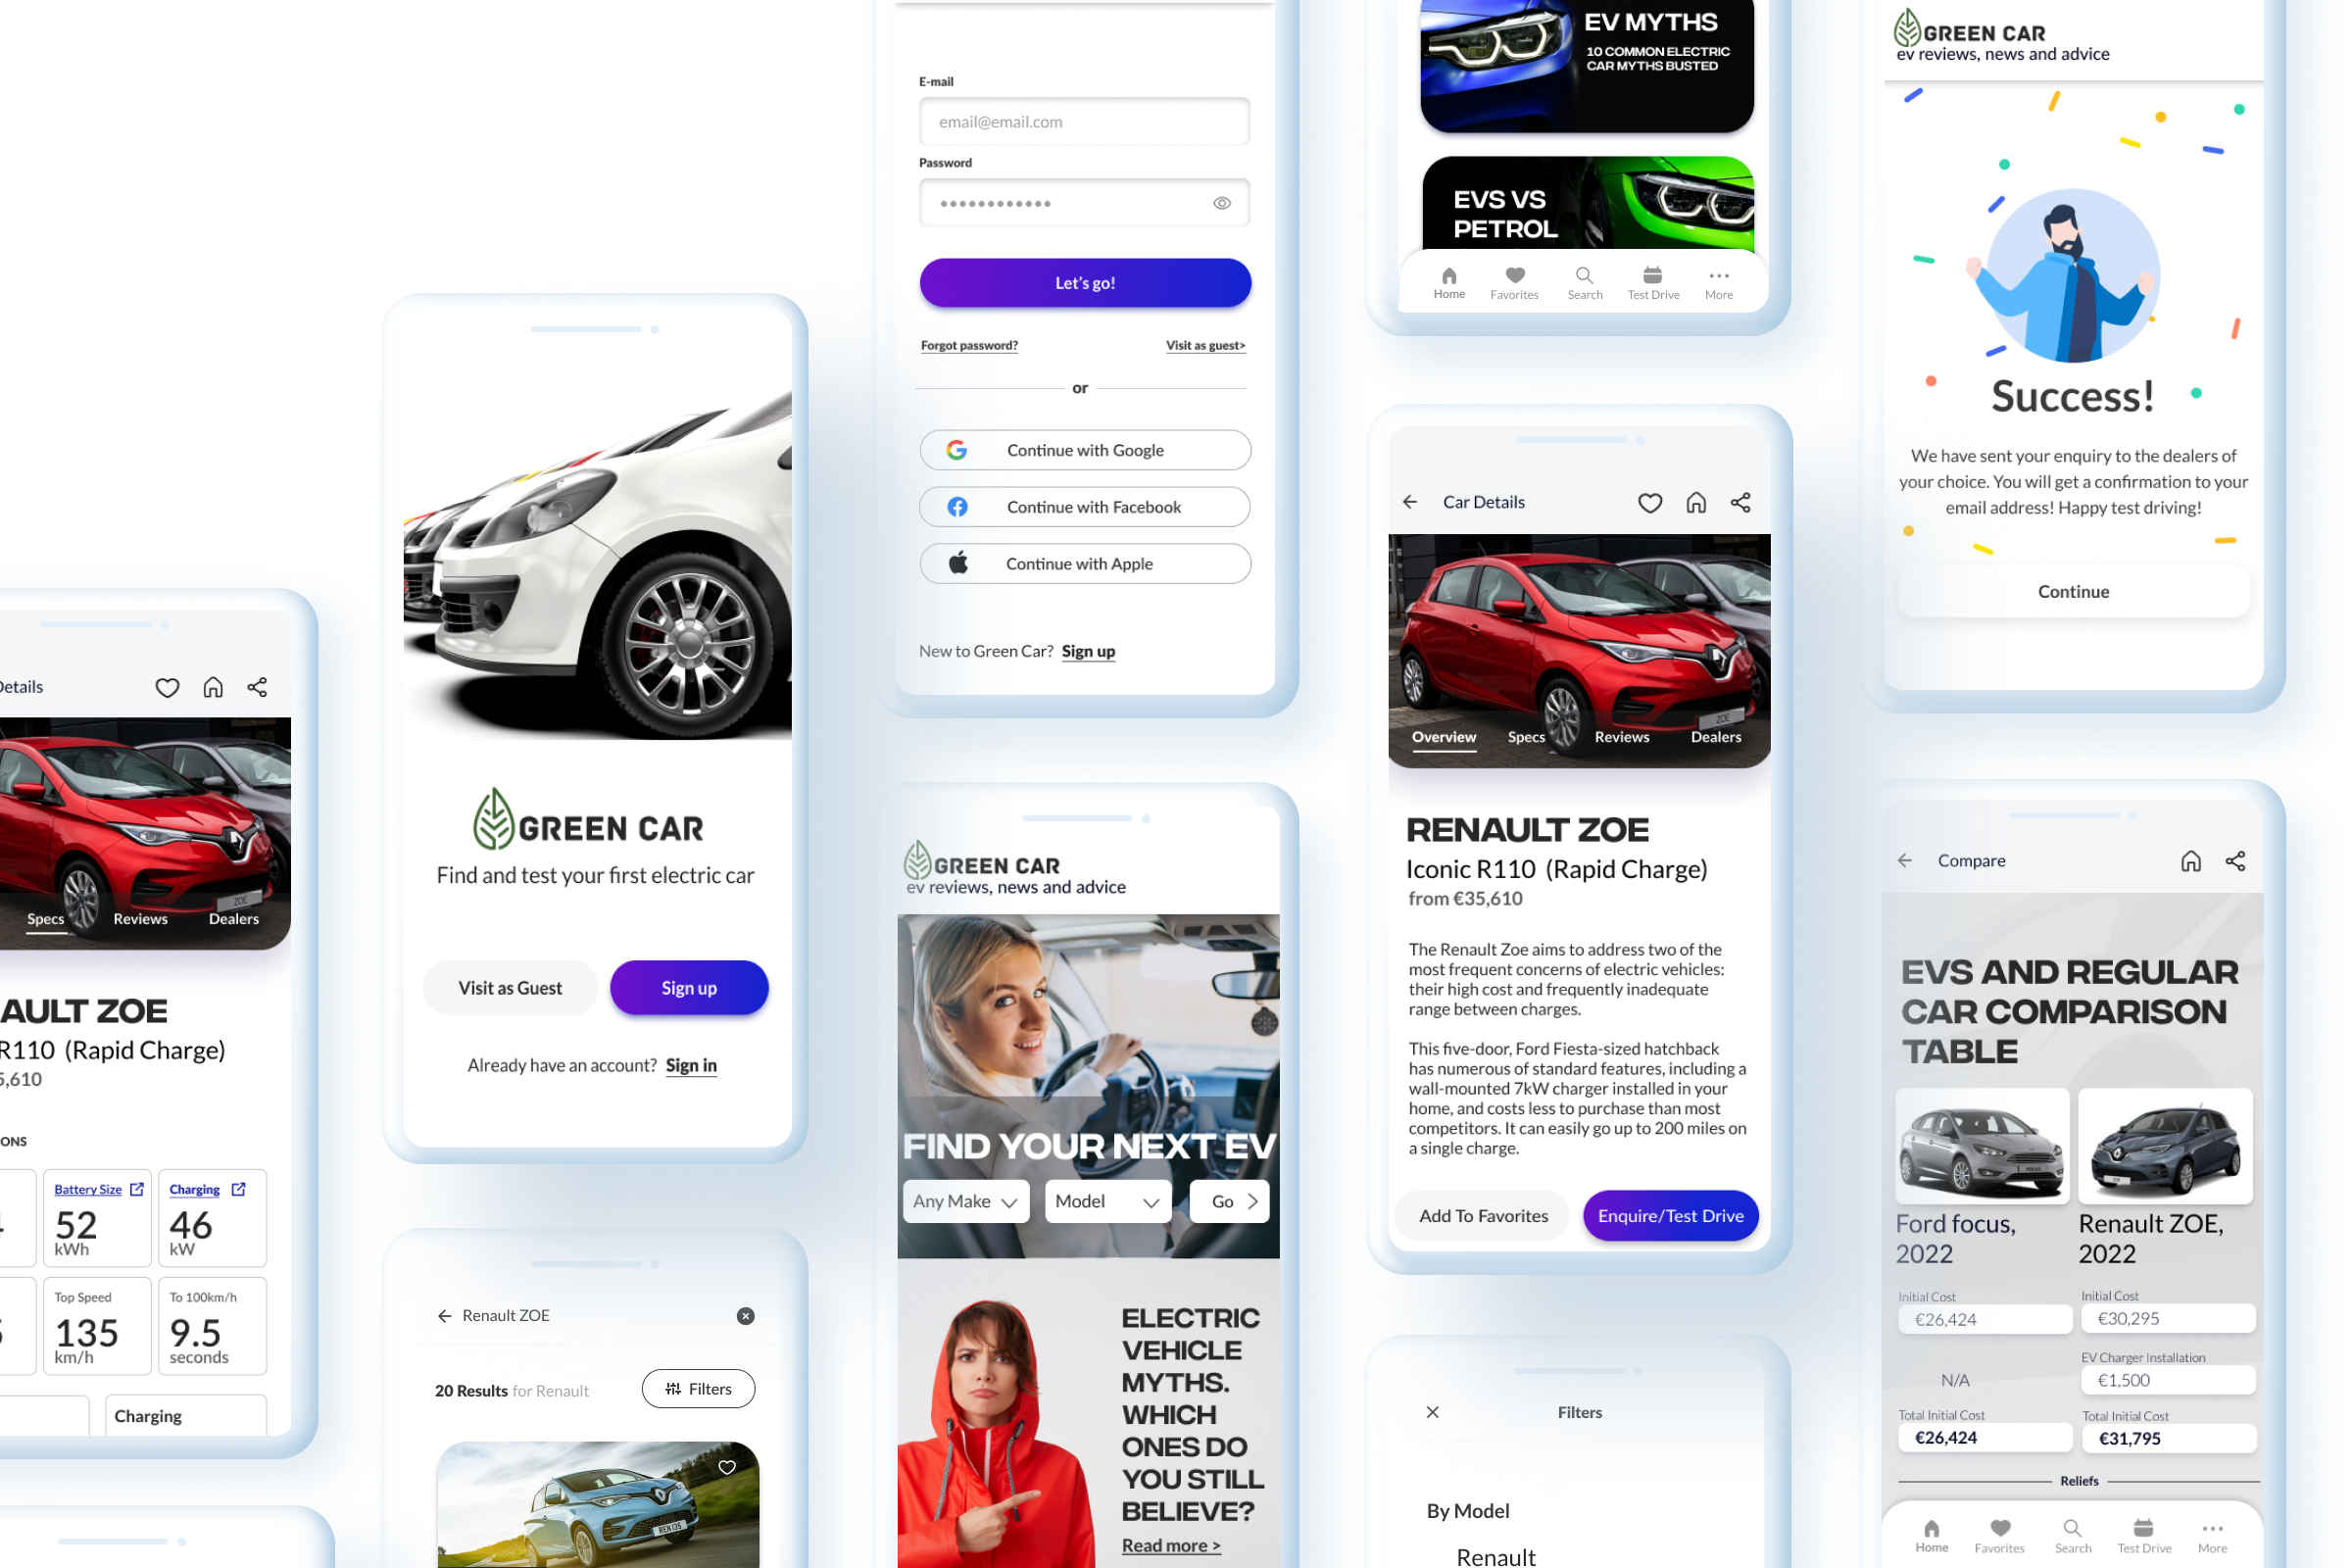
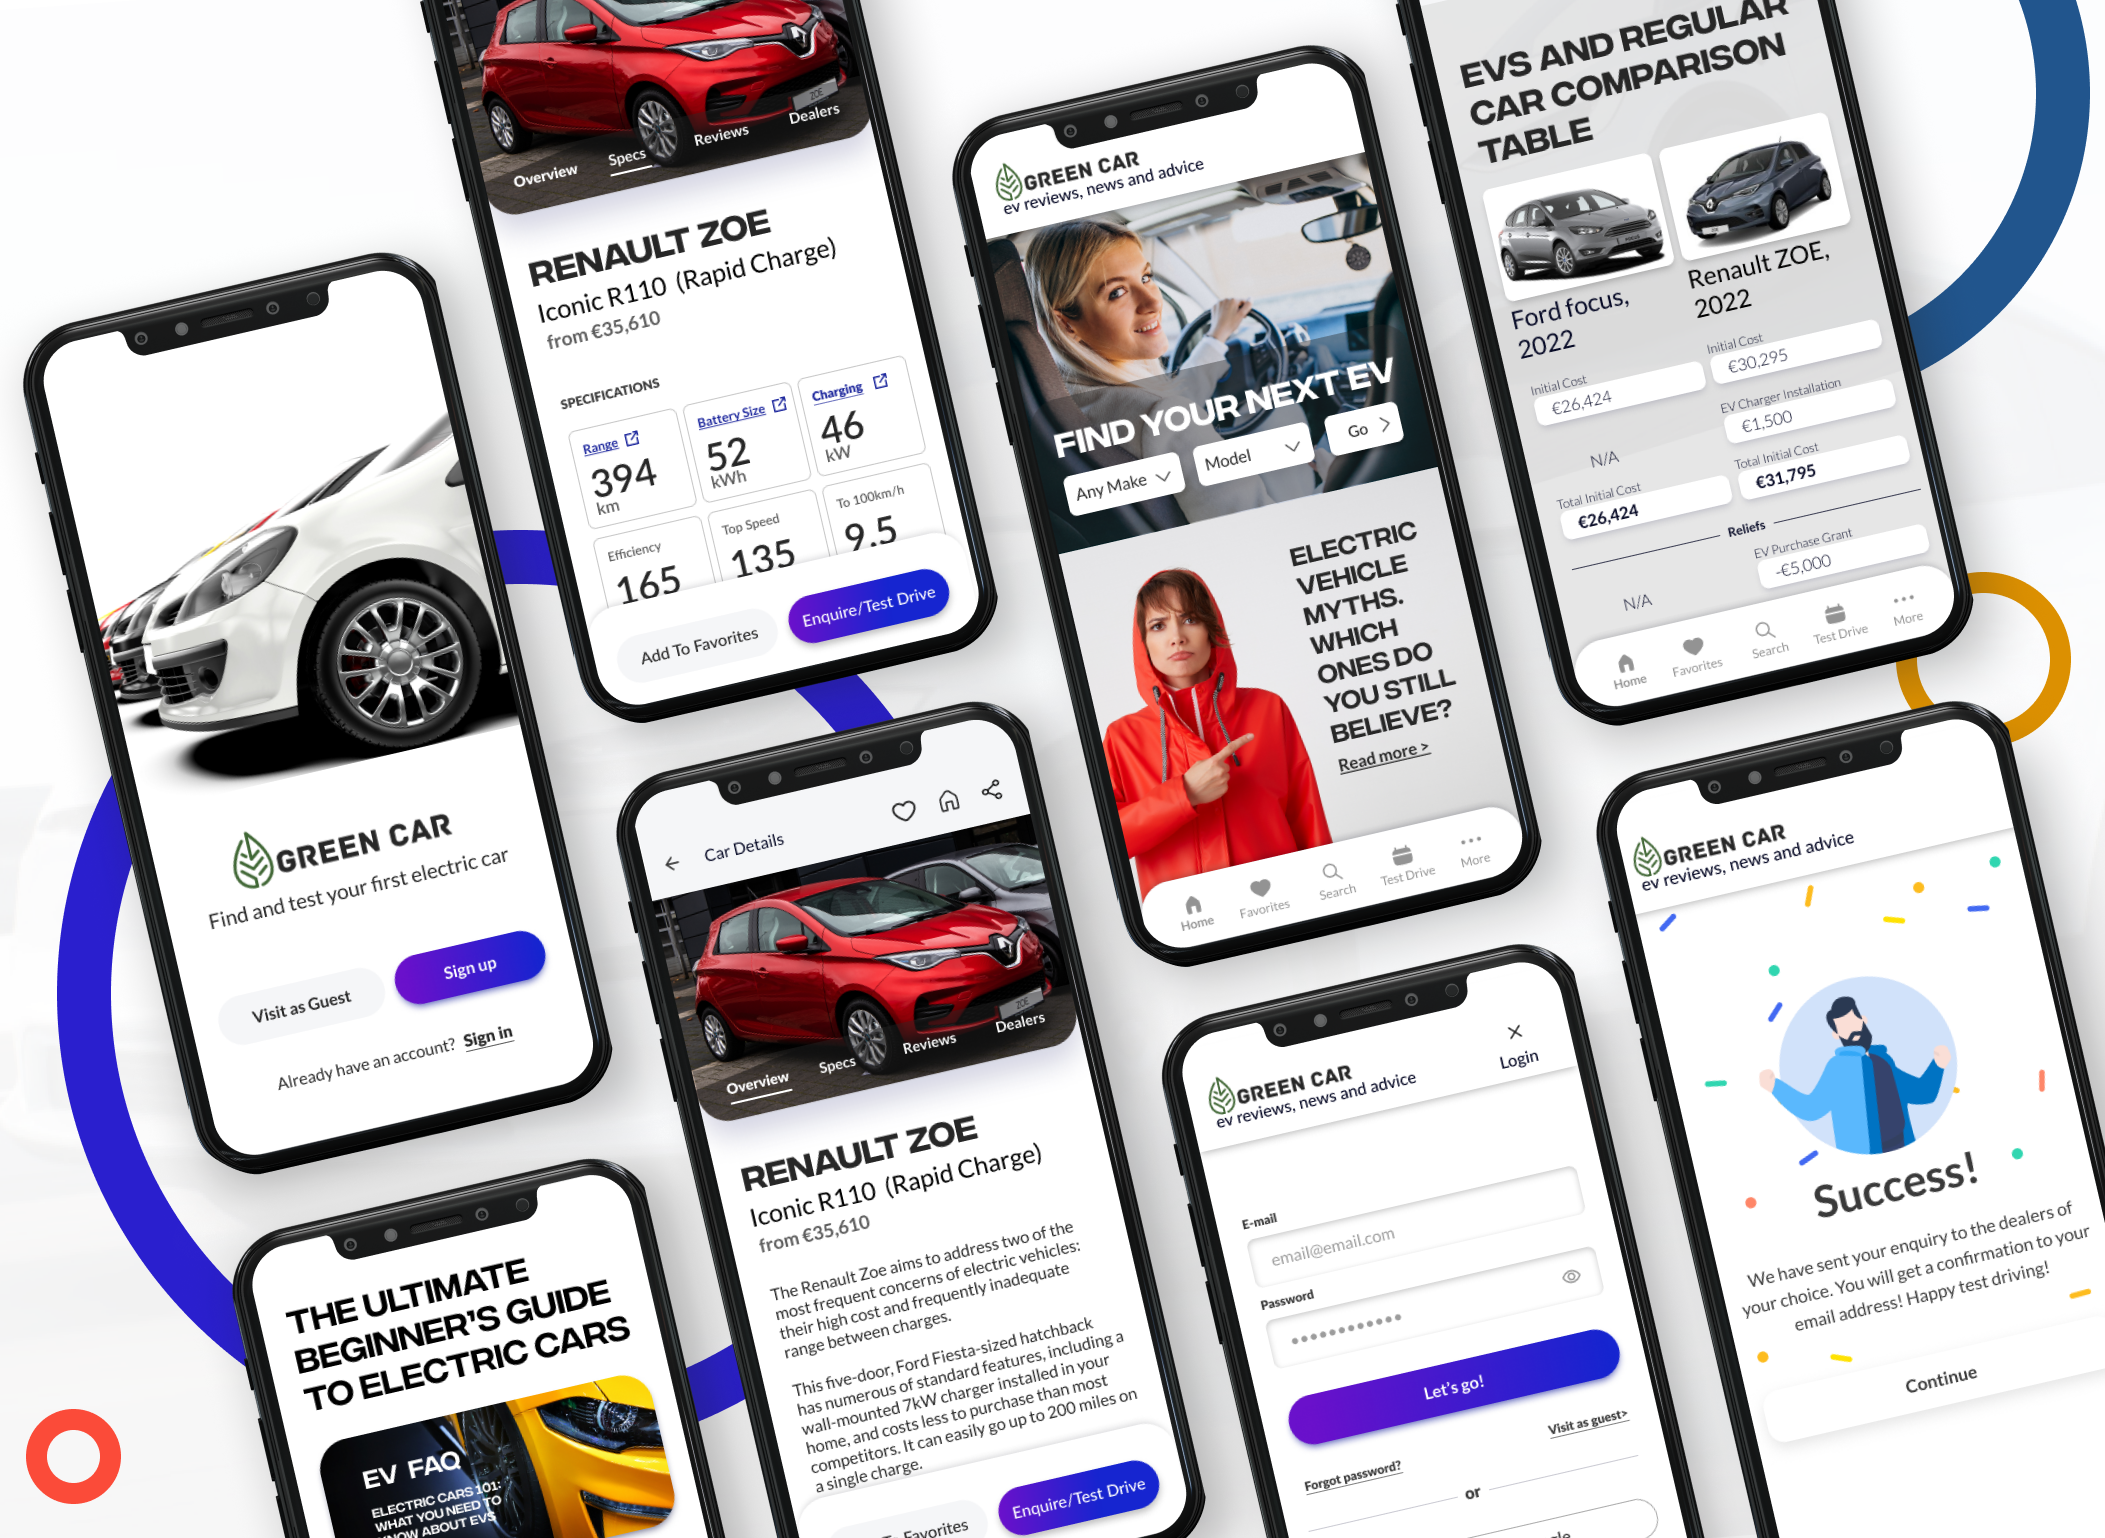
Final Solution & Video Walkthrough

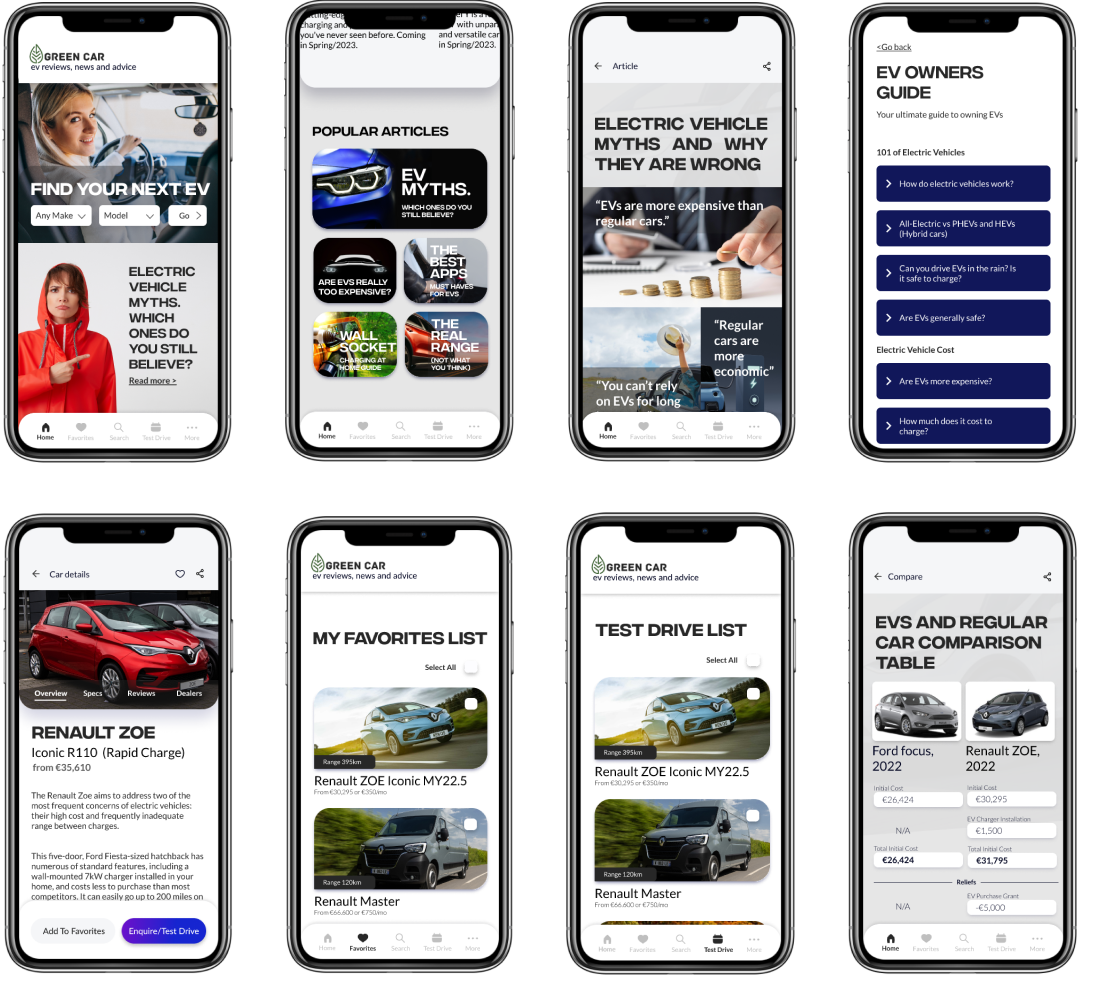
After implementing all adjustments, I ended up with the final high-fidelity prototype.
The mobile application has 19 distinct pages and allows finding EVs, adding them to the favourites list, checking their specifications, reviews, and dealers list, adding them to the test drive list and requesting a callback from the dealers. Additionally, this app has plenty of basic information about EVs (EV FAQ) and pages designed to bust existing EV misperceptions (EV myths page and EV vs Regular car cost comparison page). As one of the users said during testing, it is a “fabulous resource of all things EV”.
According to the users who tested the app, the app’s usability is good, and the flows are straightforward to understand and follow. I addressed the issues that arose during usability tests; however, another set of usability tests would be handy to test my decisions.
Conclusions & Key Takeaways
Overall, it was a brilliant experience, and I enjoyed researching this topic as I went through all the stages of the UX/UI process. However, this is a conceptual case study explicitly made as a research project for the Master’s thesis, and I was limited in time and scope. If I were to do this case in real life, I would do some things differently:
I would explore other problems, such as questions about installers and installation, as when doing research, I figured out there was a clear need and lack of information on installers. Perhaps even with a rating system.
Another issue for exploration is the second-hand e-car market. Unfortunately, there are currently no dedicated websites for second-hand e-cars with comprehensive information about how to evaluate and choose a second-hand e-vehicle.
I would still have an app for finding e-vehicles, but in addition to that, I would also build a landing page and a blog about EVs.
Building this case taught me much about the UX process and research methods, such as social media research, usability testing and surveys. Furthermore, it was an excellent opportunity to learn about product management, as Increasing EV adoption in Ireland required considering product lifecycle and innovation marketing questions. In addition, I had a lot of “aha” and “wow” moments and was surprised to discover how much significance people’s psychology and perceptions make and how “common sense” things are sometimes not common at all.
Method 1: Social Media Listening